FIGURE 2.
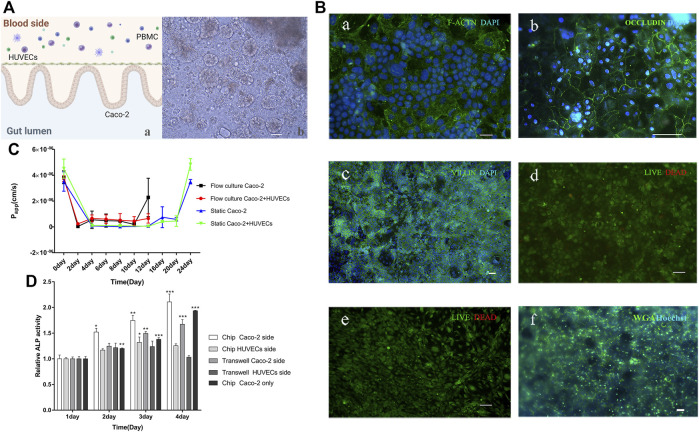
Human gut-on-a-chip. (A) A schematic diagram and a micrograph of the gut-on-a-chip. a: A schematic of the intestinal system; b: The bright-field images of a five-day-old gut-on-a-chip, the wavy 3D epithelial structures were observed in the microfluidic chip (Scale bar, 100 μm). (B) Immunofluorescence images of gut-on-a-chip culture for 5 days. a: F-actin (green); Caco-2 cell nuclei (blue); b: Occludin (green); HUVECs cell nuclei (blue); c: villi (green); Caco-2 cell nuclei (blue); d: showing the viability of the Caco-2 cells (live cells in green, dead in red); e: showing the viability of the HUVECs cells (live cells in green, dead in red); f: WGA (green); Caco-2 cell nuclei (blue), (Scale bar, 50 μm). (C) Apparent paracellular permeability (Papp) is measured by real-time quantitating fluorescent dextran 3-5 KDa transport through the Caco-2 monolayer or coculture with HUVECs cultured in static Transwell® chamber for 24 days or in the flow culture microfluidic chip for 12 days. (D) Intestinal alkaline phosphatase (ALP) activity of cocultured in the static Transwell® system or flow coculture in the microfluidic chip, or only Caco-2 flow culture in a chip for 1–4 days. For the coculture system, the Caco-2 and HUVECs side were measured, respectively. (chip Caco-2 side, chip HUVECs side, Transwell Caco-2 side, and Transwell HUVECs side) (n = 3; *p < 0.05, **p < 0.005, ***p < 0.0005).

