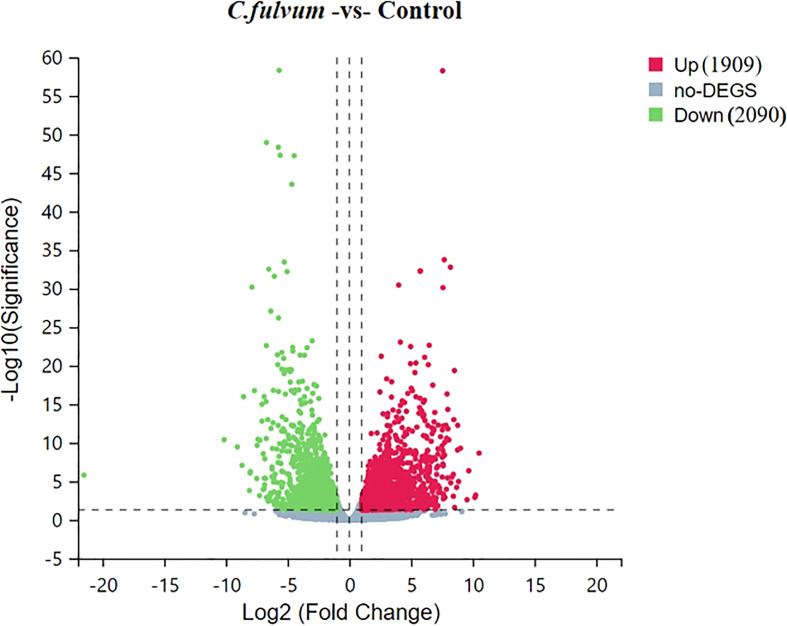
Figure 3.
Volcano plot of upregulated and downregulated differentially expressed genes (DEGs) after Cladosporium fulvum inoculation. X-axis represents log2 transformed difference multiplier values and Y-axis represents -log10 transformed significance values. Red dots represent upregulated DEGs, green dots represent downregulated DEGs, and gray dots represent that were not significantly different between C.fulvum and control treatment.

