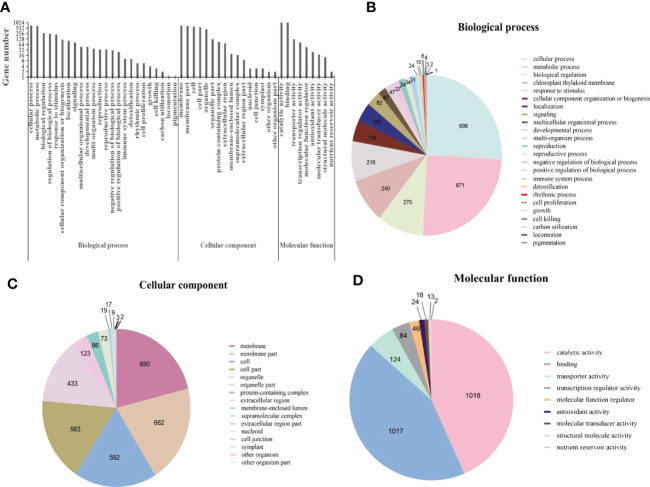
Figure 4.
Gene ontology (GO) annotations for differentially expressed genes (DEGs) in Cladosporium fulvum inoculated tomato leaves vs control treatment. (A) GO classifications of differential genes in C fulvum vs control treatment. Pie charts showing the breakdown and prevalence of enriched GO terms in the following categories: biological process (B), cellular component (C) and molecular function (D).

