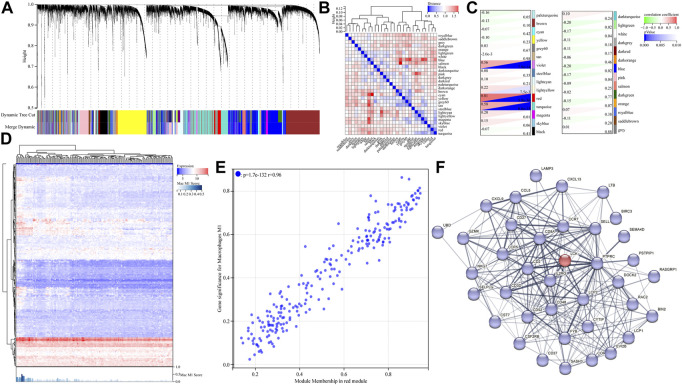
FIGURE 3.
Identification of hub genes correlated with M1-like macrophage infiltration in the GSE21122 dataset. (A) Dendrogram of all differentially expressed genes clustered based on a dissimilarity measure. Dynamic tree cutting was applied to identify modules by dividing the dendrogram at significant branch points. (B) Heatmap of the adjacencies of modules along with the module trait relationship. (C) Correlation between the expression of the gene module and clinical characteristic (M1-like macrophage infiltration). (D) Heatmap of the expression level of genes in the red module obtained from WGCNA analysis. (E) Gene significance–module membership (GS-MM) scatter diagram of genes in THE red module. (F) Protein–protein interaction analysis of all candidate hub genes in the red module, via the STRING database.

