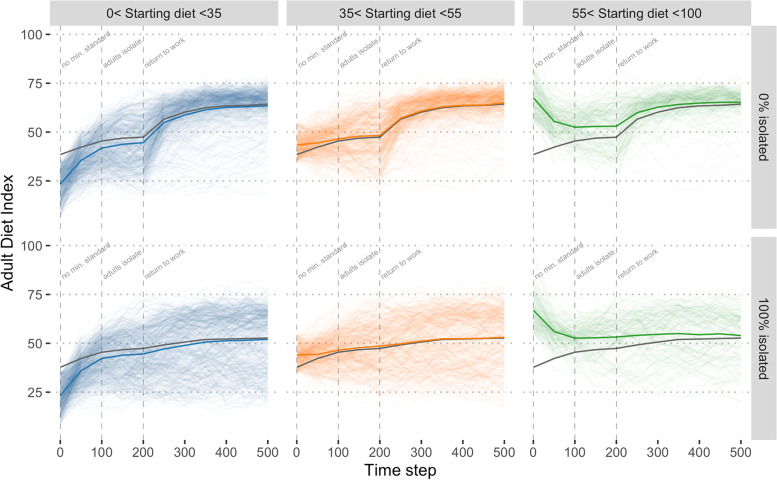
Fig. 4.
The adult diet index, stratified by starting value (columns) and isolation scenario (row). Each line indicates a single adult from one realisation of the model from a model with no minimum standards (0–100 time steps), adults isolated at home (100–200 time-steps) and followed by a return to work (top row) and minimum standards (of 60) or continued isolation at home (bottom). The population was stratified by their starting diet indices into three approximately equal groups for clarity. Thick coloured lines indicate the mean of the panel and the grey line indicates the mean of the population (i.e. for each row)

