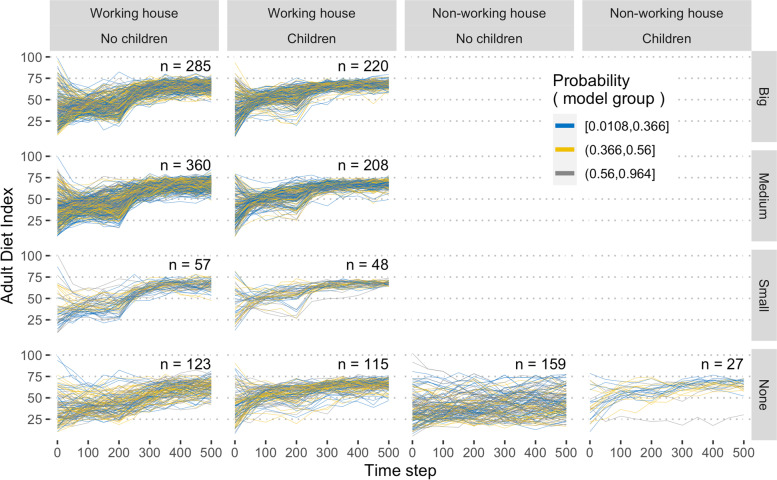
Fig. 6.
The time series of individual adult diet index stratified by household and workplace. The trajectory of every adult agent (n = 1602) from one realisation of the model assuming universal minimum standards of 60 is illustrated. Adult agents are stratified by whether the household contained any working or all unemployed adults and whether or not there were children present (column). They were also stratified by the size of the agent’s workplace (if any) (row) and the tertile of the weight for modelling the group norm (colour). The number of agents in each category is indicated

