

Abstract
Background
Avoiding causative allergens is important for controlling the clinical course of allergic diseases. Allergen sensitization is influenced by many factors including the environment and lifestyle. The socioeconomic development, climate, and lifestyle changes have increased the prevalence of allergic diseases worldwide. However, there is little information about changes in the trend of the common allergens over time.
Objective
This study was aimed at identifying the trends of the common allergens in Korea over a 10-year period based on the results of the multiple allergosorbent test chemiluminescent assay (MAST-CLA).
Methods
We retrospectively reviewed the medical records of 5,760 patients aged ≥18 years who visited the Dermatology Department at a tertiary hospital over a period of 10 years. The serum total immunoglobulin (Ig) E and specific IgE levels to 41 allergens were determined using MAST-CLA, along with the clinical diagnosis, duration of illness, white blood cell count and eosinophil percentage.
Results
Dermatophagoides farinae, Dermatophagoides pteronyssinus, and house dust were the most prevalent allergens during the 10 years period, but the percentage of higher class responses has decreased in recent years. The number of patients sensitized to house dust (p<0.001), dogs (p=0.005), and cats (p<0.001) increased while that of patients sensitized to cockroaches (p<0.001) and storage mites (p<0.001) decreased over time. There were no significant changes in the total number of sensitizing allergens over time.
Conclusion
The common allergens have changed over time. Based on the findings of this study, physicians and patients should consider changing their strategies for disease prevention and management.
Keywords: Allergens, Allergy, Atopic dermatitis, Immunoglobulin E, Multiple allergosorbent test chemiluminescent assay, Time trend
INTRODUCTION
The prevalence of allergic diseases such as atopic dermatitis is on the rise worldwide1,2. Although the exact etiology of allergic diseases is not known, it is thought that genetic and environmental factors, along with immunological dysfunction play an important role. In particular, allergens are involved in the onset and exacerbation of symptoms, thus, avoiding causative allergens is important in controlling the disease’s clinical course and maintaining a good quality of life3.
Allergen sensitization is influenced by many factors including genetics, age, and environmental factors. As there are significant changes in the environment and lifestyle, common allergens may also have changed over time. Therefore, identifying the trends of common allergens and taking appropriate preventive measures is essential for disease management.
Multiple allergosorbent test chemiluminescent assay (MAST-CLA) is a quick and simple method that detects multiple allergen-specific immunoglobulin (Ig) Es quantitatively with a relatively small amount of serum. In addition to the skin prick test and immunoCAP assays, the reliability and accuracy of MAST-CLA in detecting IgE have also been validated in many studies4,5.
Several studies on allergen sensitization in allergic disease patients have shown that house dust mites are the most prevalent allergens6,7. However, to the best of our knowledge, data on the time and distribution trends, and severities of the common allergens are limited. Thus, the purpose of this study was to investigate the pattern of the common allergens over time based on the MAST-CLA results.
MATERIALS AND METHODS
Study subject
We retrospectively reviewed the medical records of patients aged ≥18 years who underwent MAST-CLA in the Department of Dermatology at Incheon St. Mary’s Hospital, Incheon, Korea, from January 2011 to April 2020. The Advansure Alloscreen® (LG Life Science, Seoul, Korea) was used to detect allergen-specific IgEs in the serum. A total of 41 allergens on the Korean inhalant and food panel were examined from January 2011 to February 2017, and 62 allergens on the Korean standard and food panel were examined from March 2017 to April 2020 because of the change in panels. Overall, we analyzed 41 allergens over the study period as follows: alder and birch mix, Alternaria alternata, Aspergillus fumigatus, baker’s yeast, barley meal, beef, buck-wheat, Candida albicans, cat, cheddar cheese, chicken, citrus mix, Cladosporium herbarum, cockroach, codfish, crab, Dermatophagoides farinae, Dermatophagoides pteronyssinus, dog, egg white, garlic, house dust, Japanese hop, mackerel, milk, mugwort, oak white, onion, peach, peanut, pork, rice, rye pollens, salmon, short ragweed, shrimp, soy bean, storage mite, tomato, tuna, and wheat flour.
The specific IgE levels were categorized into seven classes where Class 0 represents a specific IgE level of 0.00~0.34 IU/ml (negative findings), Class 1 0.35~0.69 IU/ml (low threshold response), Class 2 0.70~3.49 IU/ml (increased response), Class 3 3.50~17.49 (significantly increased response), Class 4 17.50~49.99 IU/ml (high response), Class 5 50.00~99.99 IU/ml (very high response), and Class 6 >100.00 IU/ml (extremely high response). Class 2 or greater was considered positive to sensitization to the specific allergen.
In addition to the MAST-CLA results, we obtained the following data: the patient’s age, sex, dermatologic diagnosis, duration of illness, serum total IgE level, white blood cell (WBC) count and eosinophils as a percentage of WBC. The total serum IgE was measured by enzyme immunoassay (EIA), and it was considered to have increased if the level was higher than 165.30 IU/ml. If the value exceeded 3,000 IU/ml, it was considered as 3,000 IU/ml. This study was approved by the Institutional Review Board of the Catholic University of Korea, Incheon St. Mary’s Hospital (IRB no. OC21RASI0058). The informed consent was waived.
Statistical analyses
The clinical characteristics are presented as number (%) and mean±standard deviation (SD) and the prevalence is expressed in percentage. The values of IgE, WBC, eosinophil and the number of MAST-CLA responses were expressed as mean±SD. For allergens with high incidence rate, the number and rate of positive responses and their ranks were analyzed by year and also over the entire period.
One way analysis of variance (ANOVA) test was performed to analyze the annual trends of IgE, WBC, eosinophil and positive MAST-CLA responses. To investigate whether there are statistically significant changes in the clinical characteristics of subjects and their results including MAST-CLA over time, we divided the entire study period into two: the first five years and the latter five years. Chi-squared tests and independent t-tests were performed to analyze the differences of the above values between the first five and the latter five years. Independent t-tests were performed to evaluate the changes (increase or decrease) in an individual's allergen sensitization. A p-value <0.05 was considered statistically significant. All statistical analyses were performed using SPSS version 21.0 (IBM Corp., Armonk, NY, USA).
RESULTS
In total, 5, 760 patients who underwent MAST-CLA from January 2011 to April 2020 were enrolled. Among them, 2,236 cases were male (38.8%, 43.2±17.3 years old) and 3,524 were female (61.2%, 43.4±15.6 years old). The most common dermatological diagnosis was acute urticaria (28.3%), followed by chronic urticaria (21.3%), allergic contact dermatitis (9.9%), atopic dermatitis (8.8%) and others (31.6%) including infectious skin disorders, and drug eruptions. The duration of illness ranged from one day to 40 years with an average of 11.0 months and an SD of 31.0 months overall; 32.1±57.7 months in atopic dermatitis, 16.5±30.8 months in chronic urticaria, 0.5±0.4 months in acute urticaria, and 8.1±21.9 months in contact dermatitis.
Annual trends of the subjects’ clinical characteristics are shown in Table 1. There was no clear annual trend for sex, age, and illness duration. The number of patients diagnosed with atopic dermatitis increased gradually from the year 2011 to 2020 compared with the other diagnoses.
Table 1. Clinical characteristics of subjects with the total IgE, WBC, eosinophil serum levels, and MAST results.
| Variable | 2011 (n=402) | 2012 (n=512) | 2013 (n=707) | 2014 (n=759) | 2015 (n=637) | 2016 (n=687) | 2017 (n=660) | 2018 (n=587) | 2019 (n=660) | 2020 (n=149) | Overall (n=5,760) | p-value | |
|---|---|---|---|---|---|---|---|---|---|---|---|---|---|
| Sex | 0.705 | ||||||||||||
| Male | 154 (38.3) | 181 (35.4) | 277 (39.2) | 286 (37.7) | 246 (38.6) | 270 (39.3) | 258 (39.1) | 238 (40.5) | 259 (39.2) | 67 (45.0) | 2,236 (38.8) | ||
| Female | 248 (61.7) | 331 (64.6) | 430 (60.8) | 473 (62.3) | 391 (61.4) | 417 (60.7) | 402 (60.9) | 349 (59.5) | 401 (60.8) | 82 (55.0) | 3,524 (61.2) | ||
| Age (yr) | 42.6±15.8 | 41.1±15.1 | 43.0±15.1 | 42.8±15.7 | 43.6±16.4 | 43.5±16.2 | 43.1±16.8 | 44.5±17.3 | 45.2±17.6 | 44.3±16.7 | 43.4±16.3 | 0.004* | |
| Diagnosis | |||||||||||||
| AD | 28 (7.0) | 35 (6.8) | 45 (6.4) | 63 (8.3) | 49 (7.7) | 61 (8.9) | 70 (10.6) | 65 (11.1) | 70 (10.6) | 19 (12.8) | 505 (8.8) | <0.001* | |
| CU | 100 (24.9) | 144 (28.1) | 140 (19.8) | 170 (22.4) | 125 (19.6) | 159 (23.1) | 130 (19.7) | 103 (17.5) | 135 (20.5) | 23 (15.4) | 1,229 (21.3) | ||
| AU | 81 (20.1) | 137 (26.8) | 231 (32.7) | 230 (30.3) | 240 (37.7) | 167 (24.3) | 166 (25.2) | 202 (34.4) | 155 (23.5) | 23 (15.4) | 1,632 (28.3) | ||
| ACD | 37 (9.2) | 50 (9.8) | 61 (8.6) | 51 (6.7) | 73 (11.5) | 51 (7.4) | 71 (10.8) | 75 (12.8) | 86 (13.0) | 18 (12.1) | 573 (9.9) | ||
| Others | 156 (38.8) | 146 (28.5) | 230 (32.5) | 245 (32.3) | 150 (23.5) | 249 (36.2) | 223 (33.8) | 142 (24.2) | 214 (32.4) | 66 (44.3) | 1,821 (31.6) | ||
| Duration of illness (mo) | 12.9±41.1 | 8.22±4.3 | 7.8±20.0 | 12.3±35.7 | 8.5±18.9 | 14.2±37.7 | 8.8±21.9 | 15.3±38.2 | 11.4±34.3 | 9.3±22.0 | 11.0±31.0 | 0.017* | |
| Total IgE (IU/ml) | 334.3±598.5 | 324.4±598.1 | 333.8±625.6 | 320.1±615.0 | 313.2±573.6 | 336.3±617.5 | 353.0±639.4 | 316.5±577.7 | 366.2±662.7 | 376.0±690.7 | 334.5±616.3 | 0.848 | |
| WBC (/μl) | 7,354±2,755 | 7,544±2,959 | 7,571±2,785 | 7,478±2,582 | 7,613±2,877 | 7,741±2,839 | 7,729±3,006 | 7,757±2,901 | 7,596±2,920 | 8,012±3,005 | 7,615±2,849 | 0.258 | |
| Eosinophil (%) | 2.9±3.0 | 3.0±3.8 | 3.2±3.5 | 3.0±2.8 | 3.0±2.8 | 3.1±3.9 | 3.2±3.8 | 3.4±4.5 | 3.3±5.1 | 3.4±4.0 | 3.1±3.6 | 0.455 | |
| The number of sensitizing allergens identified by MAST | |||||||||||||
| ≥Class 2 | 1.68±3.17 | 2.48±4.50 | 2.33±3.87 | 2.17±3.68 | 2.17±3.04 | 2.23±3.40 | 2.04±3.28 | 2.33±3.58 | 1.97±2.92 | 2.15±3.54 | 2.17±3.52 | 0.037* | |
| ≥Class 3 | 1.07±2.32 | 1.54±3.28 | 1.46±2.83 | 1.42±2.70 | 1.35±2.15 | 1.40±2.68 | 1.07±2.11 | 1.20±2.37 | 0.97±1.82 | 1.11±2.42 | 1.28±2.51 | <0.001* | |
| ≥Class 4 | 0.61±1.53 | 0.92±2.37 | 0.86±1.97 | 0.91±1.86 | 0.80±1.46 | 0.86±2.04 | 0.42±1.11 | 0.43±1.07 | 0.36±0.86 | 0.48±1.41 | 0.69±1.66 | <0.001* | |
| ≥Class 5 | 0.39±1.05 | 0.62±1.66 | 0.60±1.53 | 0.63±1.35 | 0.54±1.13 | 0.59±1.50 | 0.18±0.62 | 0.15±0.50 | 0.13±0.46 | 0.15±0.47 | 0.42±1.21 | <0.001* | |
Values are presented as number (%) or mean±standard deviation. IgE: immunoglobulin E, WBC: white blood cell, MAST: multiple allergen simultaneous test, AD: atopic dermatitis, CU: chronic urticaria, AU: acute urticaria, ACD: allergic contact dermatitis. Annual rates were compared by one way analysis of variance test, showing significant difference between each year *p<0.05.
The annual and overall serum levels of the total IgE, WBC, eosinophil and the number of MAST-CLA positive panels are also shown in Table 1. Overall, the mean value of IgE was 334.5±616.3 IU/ml, WBC was 7,615±2,849 (/ml), and eosinophil was 3.1±3.6 (%). The number of positive allergen per patient over the entire study period was 2.17±3.52, for Class 3 was 1.28±2.51, for Class 4 was 0.69±1.66, for Class 5 was 0.42±1.21. According to the one-way ANOVA test, there was a significant difference in the number of responses for classes 2, 3, 4, and 5 between the years. On the other hand, there was no significant difference between the years with regards to IgE, WBC count, and eosinophil percentages.
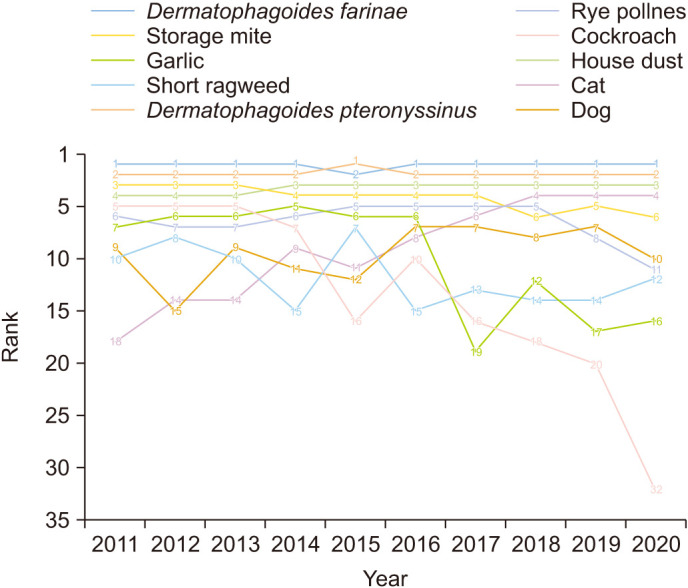
Each year's 10 most common allergens are in Table 2. The 10 most common allergens during the entire study period were D. farinae, D. pteronyssinus, house dust, storage mite, rye pollen, cat, garlic, cockroach, dog, and short ragweed in decreasing order (Supplementary Table 1). The positive responses of these 10 allergens changed (increased or decreased) over time, which led to changes in their ranking (Fig. 1). The three most common allergens were D. farinae, D. pteronyssinus, and house dust, and were constant over the years. The cat, dog, shrimp, peach, alder-birch mix allergens ranked higher while storage mite, rye pollen, garlic, onion, crab, and cockroach ranked lower over time.
Table 2. The 10 most common allergens.
| Rank | 2011 | 2012 | 2013 | 2014 | 2015 | 2016 | 2017 | 2018 | 2019 | 2020 | Overall |
|---|---|---|---|---|---|---|---|---|---|---|---|
| 1 | D. farinae | D. farinae | D. farinae | D. farinae | D. pteronyssinus | D. farinae | D. farinae | D. farinae | D. farinae | D. farinae | D. farinae |
| 2 | D. pteronyssinus | D. pteronyssinus | D. pteronyssinus | D. pteronyssinus | D. farinae | D. pteronyssinus | D. pteronyssinus | D. pteronyssinus | D. pteronyssinus | D. pteronyssinus | D. pteronyssinus |
| 3 | Storage mite | Storage mite | Storage mite | House dust | House dust | House dust | House dust | House dust | House dust | House dust | House dust |
| 4 | House dust | House dust | House dust | Storage mite | Storage mite | Storage mite | Storage mite | Cat | Cat | Cat | Storage mite |
| 5 | Cockroach | Cockroach | Cockroach | Garlic | Rye pollens | Rye pollens | Rye pollens | Rye pollens | Storage mite | Peach | Rye pollens |
| 6 | Rye pollens | Garlic | Garlic | Rye pollens | Garlic | Garlic | Cat | Storage mite | Shrimp | Shrimp | Cat |
| Alder-birch mix | |||||||||||
| Storage mite* | |||||||||||
| 7 | Garlic | Rye pollens | Rye pollens | Cockroach | Short ragweed | Dog | Dog | Oak white | Dog | Garlic | |
| 8 | Mugwort | Short ragweed | Onion | Candida albicans | C. albicans | Cat | Aspergillus fumigatus | Dog | Rye pollens | Cockroach | |
| 9 | Dog | Onion | Dog | Cat | Milk | C. albicans | Cladosporium herbarum | Mugwort | Peach | C. albicans | Dog |
| 10 | Onion | Peach | Short ragweed | Crab | Crab | Cockroach | Oak white | Alder-birch mix | Alder-birch mix | Dog | Short ragweed |
| Short ragweed | |||||||||||
| C. albicans * |
D. farinae: Dermatophagoides farinae, D. pteronyssinus: Dermatophagoides pteronyssinus. *Having multiple allergens in a cell means they occupy the same rank.
Fig. 1. Annual change in rank of the 10 most common allergens.
The positive response rates of the 10 most common allergens according to intensity were compared each year to evaluate the trends of sensitization in detail (Fig. 2). Over time, specific IgE responses to cat, dog, egg white, shrimp, peach, alder-birch mix, and oak white allergens were shown to increase. On the other hand, responses to the storage mite, rye pollen, garlic, cockroach, short ragweed, crab, onion, milk, pork, beef, wheat flour, and peanut allergens decreased. The positive rates of specific IgE to cat allergen increased for all the classes, while those of the dog allergen increased only for classes 2, 3, and 4 and decreased for class 5. The degree of sensitization for the three most common allergens, D. farinae, D. pteronyssinus and house dust, was high all through the study period, but the percentage of severe responses of classes 4, 5 or higher, decreased.
Fig. 2. Annual change in the positive response rates of the 10 most common allergens.

To investigate whether there are statistically significant changes in the clinical characteristics of subjects and their results including MAST-CLA over time, we divided the entire study period into two: the first five years and the latter five years (Table 3). There was a significant difference in the patients’ age, diagnosis, and WBC count between the two periods (age, p=0.001; diagnosis, p<0.001; WBC, p=0.012). Atopic dermatitis and allergic contact dermatitis were more common in patients enrolled from 2016 to 2020 than in those enrolled in the first five years. The number of positive MAST-CLA responses did not differ between the two time periods while those of higher intensity decreased (Class 3, p=0.001; Class 4, p<0.001; Class 5, p<0.001).
Table 3. Comparison of subjects’ clinical characteristics and responses between the first five years and latter five years.
| Variable | 2011~2015 (n=3,017) | 2016~2020 (n=2,743) | p-value | |
|---|---|---|---|---|
| Sex | ||||
| Male | 1,144 (37.9) | 1,092 (39.8) | 0.141 | |
| Female | 1,873 (62.1) | 1,651 (60.2) | ||
| Age (yr) | 42.7±15.6 | 44.1±17.0 | 0.001* | |
| Diagnosis | ||||
| AD | 220 (7.3) | 285 (10.4) | <0.001* | |
| CU | 679 (22.5) | 550 (20.1) | ||
| AU | 919 (30.5) | 713 (26.0) | ||
| ACD | 272 (9.0) | 301 (11.0) | ||
| Others | 927 (30.7) | 894 (32.6) | ||
| Duration of illness (mo) | 9.8±28.7 | 12.0±32.9 | 0.05 | |
| IgE (IU/ml) | 324.5±603.6 | 345.4±629.8 | 0.198 | |
| WBC (/μl) | 7,523±2,781 | 7,725±2,924 | 0.012* | |
| Eosinophil (%) | 3.04±3.18 | 3.23±4.04 | 0.061 | |
| The number of sensitizing allergens identified by MAST | ||||
| ≥Class 2 | 2.20±3.70 | 2.14±3.31 | 0.517 | |
| ≥Class 3 | 1.39±2.70 | 1.16±2.28 | 0.001* | |
| ≥Class 4 | 0.84±1.87 | 0.52±1.38 | <0.001* | |
| ≥Class 5 | 0.57±1.43 | 0.26±0.90 | <0.001* | |
Values are presented as number (%) or mean±standard deviation. AD: atopic dermatitis, CU: chronic urticaria, AU: acute urticaria, ACD: allergic contact dermatitis, IgE: immunoglobulin E, WBC: white blood cell, MAST: multiple allergen simultaneous test. Discrete variables and continuous variables are compared by chi-square test and independent t-test, respectively, showing significant difference between each year *p<0.05.
The positive response rates, which are defined as specific IgE level of class 2 or higher, of each of the 41 allergens for the two periods were compared (Table 4). A number of the allergens showed a significant difference suggesting a change in sensitization to that particular allergen over time. The following allergens carried an increased risk of sensitization: house dust (p<0.001), dog (p=0.005), cat (p<0.001), peach (p=0.002), alder-birch mix (p=0.001), oak white (p<0.001), C. herbarum (p=0.001), A. fumigatus (p<0.001), shrimp (p<0.001), and egg white (p<0.001). On the other hand, the followings were shown with a decreased risk of sensitization: storage mite (p<0.001), garlic (p<0.001), cockroach (p<0.001), short ragweed (p=0.012), C. albicans (p=0.005), crab (p=0.002), barley meal (p=0.044), pork (p=0.027), milk (p=0.001), rice (p<0.001), beef (p<0.001), citrus mix (p=0.029), salmon (p=0.019), and chicken (p=0.007).
Table 4. Comparison of the 41 allergens positive response rates between the first five years and latter five years.
| Allergen | 2011~2015 (n=3,017) | 2016~2020 (n=2,743) | p-value |
|---|---|---|---|
| Dermatophagoides farinae | 36.3±48.1 | 37.5±48.4 | 0.339 |
| Dermatophagoides pteronyssinus | 34.5±47.6 | 33.7±47.3 | 0.515 |
| House dust | 20.5±40.4 | 26.8±44.3 | <0.001* |
| Storage mite | 20.2±40.2 | 12.7±33.3 | <0.001* |
| Garlic | 8.4±27.7 | 4.5±20.8 | <0.001* |
| Cockroach | 8.1±27.2 | 3.6±18.7 | <0.001* |
| Rye pollens | 7.3±26.1 | 8.2±27.4 | 0.234 |
| Short ragweed | 5.4±22.5 | 4.0±19.5 | 0.012* |
| Onion | 5.0±21.9 | 2.7±16.1 | <0.001* |
| Candida albicans | 4.9±21.5 | 3.4±18.1 | 0.005* |
| Dog | 4.8±21.4 | 6.5±24.7 | 0.005* |
| Crab | 4.7±21.3 | 3.1±17.4 | 0.002* |
| Cat | 4.4±20.5 | 9.6±29.4 | <0.001* |
| Mugwort | 4.1±19.9 | 4.0±19.6 | 0.799 |
| Tomato | 4.1±19.8 | 4.0±19.5 | 0.842 |
| Barley meal | 3.1±17.4 | 2.3±14.9 | 0.044* |
| Peach | 3.0±17.2 | 4.7±21.1 | 0.002* |
| Pork | 2.9±16.9 | 2.0±14.1 | 0.027* |
| Milk | 2.9±16.6 | 1.6±12.4 | 0.001* |
| Rice | 2.9±16.6 | 1.4±11.8 | <0.001* |
| Wheat flour | 2.8±16.5 | 2.2±14.7 | 0.150 |
| Alder-birch mix | 2.8±16.5 | 4.4±20.5 | 0.001* |
| Beef | 2.8±16.4 | 0.1±3.8 | <0.001* |
| Peanut | 2.5±15.6 | 1.8±13.4 | 0.082 |
| Alternaria alternata | 2.4±15.4 | 3.0±17.0 | 0.184 |
| Citrus mix | 2.3±15.1 | 1.5±12.3 | 0.029* |
| Oak white | 2.2±14.6 | 4.3±20.3 | <0.001* |
| Cladosporium herbarum | 2.2±14.6 | 3.7±18.9 | 0.001* |
| Aspergillus fumigatus | 2.0±14.0 | 3.8±19.0 | <0.001* |
| Japanese hop | 1.9±13.7 | 2.3±15.1 | 0.282 |
| Buck-wheat | 1.8±13.4 | 1.4±11.8 | 0.227 |
| Soy bean | 1.5±12.0 | 0.9±9.7 | 0.074 |
| Shrimp | 1.2±11.0 | 4.6±20.9 | <0.001* |
| Yeast, bakers | 1.2±10.7 | 0.8±8.7 | 0.124 |
| Salmon | 0.7±8.5 | 0.3±5.4 | 0.019* |
| Chicken | 0.6±7.5 | 0.1±3.8 | 0.007* |
| Tuna | 0.4±6.3 | 0.3±5.4 | 0.494 |
| Codfish | 0.3±5.7 | 0.4±6.3 | 0.662 |
| Mackerel | 0.3±5.1 | 0.1±3.3 | 0.168 |
| Egg white | 0.2±4.8 | 1.2±11.1 | <0.001* |
| Cheddar cheese | 0.1±3.2 | 0.1±3.3 | 0.907 |
Values are presented as mean±standard deviation. Positive response refers to the response of Class 2 or higher. Rates are compared by independent t-test, showing significant difference between each year *p<0.05.
DISCUSSION
Allergic diseases are on the rise worldwide and this trend is expected to continue. This is attributed to the changes in the environment, climate, and lifestyle8,9,10. Accordingly, common allergens are likely to have changed over time. Considering the importance of avoiding causative allergens in the control of allergic diseases, it is important to investigate the trends of common allergens. In this study, this was evaluated using the MAST-CLA result.
This study showed a change in the trend of the common allergens in the Korean population over the past 10 years. D. farinae, D. pteronyssinus, and house dust, which are the best-known allergens6,11,12, still remain in the top ranks. However, it is noteworthy that the proportion of people who are sensitized to these allergens remain high, but the percentage of patients showing high intensity has decreased. The decrease could be attributed to the patients’ increased awareness of allergens and environmental control through the education provided by clinicians, the media, and the internet. Since the specific IgE level is reduced with allergen avoidance13, the efforts to maintain clean environment keeping concentration of house dust and dust mites low may have reduced the severe responses. In the recent decades, there has been a rapid growth in the media and an increased interest in health matters; according to Google searches, between 2001 and 2010, there were only 19 online medical news in Korean on house dust mites, between 2011 and 2015 the searched news increased to 200 and latter to 240 between 2016 and 202014,15,16. In addition, according to the user’s search statistics from Google trends, the average search rate for house dust mites and allergies has increased17, and the popularity of related products such as bedding vacuum cleaners and allergen-proof bedding has also increased. To sum up, the information on allergens and environmental management are becoming widely known through the Internet, and this may have led to the changes in the behavior of patients, resulting in decreased rate of severe allergic response to D. farinae, D. pteronyssinus, and house dust.
Several allergens including cats and dogs allergens have been shown to play a significant role in Koreans. The sensitization to cats and dogs has increased significantly, which is consistent with the results of a recent publication18; cats allergen was ranked the fourth, and dogs allergen was ranked the seventh most common allergen in 2020, which is a noticeable increase compared to the rankings in 2010. Cats and dogs allergens were the third and fourth most common allergens, respectively, with strong intensity and therefore became the most important allergic diseases causative allergens among the Koreans. This could be attributed to the increased popularity of cats and dogs as domestic pets and therefore increased exposure19. The increased sensitization could also be as a result of indirect exposure to cats and dogs through Fel d 1 cat antigen from the pet owners’ clothing in pet-free environments20,21.
The positive response rate of house dust, peach, alder-birch mix, oak white, C. herbarum, A. fumigatus, shrimp and egg white also increased. The increased sensitization to peach, alder-birch mix, and oak white could be explained by their cross-reactivity with profilins and lipid transfer proteins22,23. Profilin is a structural protein and lipid transfer protein is a plant defense protein. They are found in many pollens and fruits, cause cross-reactivity among allergens, and may influence each other to increase sensitization. The sensitization rate to tree pollens has also increased over the recent years in patients with allergic rhinitis24,25. An increase in pollen concentration from 2012 to 2016 has been reported as the reason for the increased number of patients with allergic diseases in Korea26. The increased sensitization to shrimp could be attributed to the increased exposures; according to the National Statistical Office in Korea, consumption of shrimp has increased from approximately 50,000 tons in 2014 to 80,000 tons in 2019. In addition, this could be as a result of tropomyosin, a major shrimp allergen, cross-reacting with dust mites27,28.
The importance of some allergens including storage mites and cockroaches in their contribution to allergic diseases has decreased. Their positive response and intensity have been decreased in this study. Storage mites do not belong to the Pyroglyphidae family represented by the species such as D. farinae and D. pteronyssinus, major sources of mite allergens in house dust. Since storage mites are common causative allergens in the agricultural environment29, these findings could be attributed to the gradual change of the Korean lifestyle from rural to urban in the past few decades. The cockroach is an important indoor allergen in homes along with dust mites and domesticated pets, and low socioeconomic status is a risk factor for exposure and sensitization30. In this present study, the decrease in cockroach sensitization could be a result of improved hygiene in Korea over the past decades.
The average number of positive allergens has not changed over time although the prevalence of allergic diseases has increased. These findings are different from those of the previous study that reported an increase in the rate of multiple allergen sensitizations in Korean children31. As the subjects in this study are adults, they are already exposed and accustomed to the external environment changes and inhaled allergens, resulting in little additional sensitization to the allergens compared to children.
The allergen sensitization trends differ by country because they are influenced by various factors, including race, socioeconomic, and environmental factors. In a study analyzing food-specific IgE changes using data from the National Health and Nutrition Examination Survey in the United States, unlike this study, the sensitization rate to shrimp decreased and the rate to egg white did not change32. This may be due to different food habits and environments that affect allergen exposures. Another study in the United States found racial and ethnic differences in the allergic disease prevalence and allergen sensitization trends33. An analysis of Finnish and Russian Karelia, which are geographically adjacent but have different socioeconomic and cultural environments, showed that the sensitization rates to birch pollen and cats increased in Finnish, but did not in Russian Karelia over the past decade34. Putting these findings together, it would be worth investigating whether there are such differences among patients with various socioeconomic or cultural backgrounds in Korea as well.
In conclusion, the trend of common allergens in the Korean population has changed over the past decade. House dust and dust mites are still the most prevalent allergens, but the percentage of those with severe responses has decreased in recent years. There was increased sensitization to house dust, cats, and dogs and a decreased in cockroaches and storage mites. While the prevalence of allergic diseases has increased, there was no significant difference in the number of sensitizing allergens identified by MAST-CLA in the adult population over time. We believe that the findings of this study will provide guidance to the physicians and patients in planning for allergic disease prevention and management.
Footnotes
CONFLICTS OF INTEREST: The authors have nothing to disclose.
FUNDING SOURCE: None.
DATA SHARING STATEMENT
The data that support the findings of this study are available from the corresponding author upon reasonable request.
SUPPLEMENTARY MATERIALS
Supplementary data can be found via http://anndermatol.org/src/sm/ad-21-260-s001.pdf.
Annual and overall positivity rates of the 10 most common allergens
References
- 1.Odhiambo JA, Williams HC, Clayton TO, Robertson CF, Asher MI. Global variations in prevalence of eczema symptoms in children from ISAAC Phase Three. J Allergy Clin Immunol. 2009;124:1251–1258.e23. doi: 10.1016/j.jaci.2009.10.009. [DOI] [PubMed] [Google Scholar]
- 2.Kim BK, Kim JY, Kang MK, Yang MS, Park HW, Min KU, et al. Allergies are still on the rise? A 6-year nationwide population-based study in Korea. Allergol Int. 2016;65:186–191. doi: 10.1016/j.alit.2015.11.002. [DOI] [PubMed] [Google Scholar]
- 3.Custovic A, Simpson A, Chapman MD, Woodcock A. Allergen avoidance in the treatment of asthma and atopic disorders. Thorax. 1998;53:63–72. doi: 10.1136/thx.53.1.63. [DOI] [PMC free article] [PubMed] [Google Scholar]
- 4.Park DS, Cho JH, Lee KE, Ko S, Kim HR, Choi SI, et al. Detection rate of allergen-specific IgE by multiple antigen simultaneous test-immunoblot assay. Korean J Lab Med. 2004;24:131–138. [Google Scholar]
- 5.Jang WR, Nahm CH, Kim JH, Lim DH, Jang TY, Moon YS, et al. Allergen specific IgE measurement with Polycheck Allergy: comparison of three multiple allergen simultaneous tests. Korean J Lab Med. 2009;29:465–472. doi: 10.3343/kjlm.2009.29.5.465. [DOI] [PubMed] [Google Scholar]
- 6.Kang MG, Kim MY, Song WJ, Kim S, Jo EJ, Lee SE, et al. Patterns of inhalant allergen sensitization and geographical variation in Korean adults: a multicenter retrospective study. Allergy Asthma Immunol Res. 2017;9:499–508. doi: 10.4168/aair.2017.9.6.499. [DOI] [PMC free article] [PubMed] [Google Scholar]
- 7.Rhee CS, Wee JH, Ahn JC, Lee WH, Tan KL, Ahn S, et al. Prevalence, risk factors and comorbidities of allergic rhinitis in South Korea: the fifth Korea national health and nutrition examination survey. Am J Rhinol Allergy. 2014;28:e107–e114. doi: 10.2500/ajra.2014.28.4040. [DOI] [PubMed] [Google Scholar]
- 8.Park SH, Lim DH, Son BK, Kim JH, Song YE, Oh IB, et al. Sensitization rates of airborne pollen and mold in children. Korean J Pediatr. 2012;55:322–329. doi: 10.3345/kjp.2012.55.9.322. [DOI] [PMC free article] [PubMed] [Google Scholar]
- 9.Hong SJ. Report of Korean ISAAC epidemiologic study for asthma and allergic diseases in children. Pediatr Allergy Respir Dis. 2007;17(Suppl 1):S55–S66. [Google Scholar]
- 10.Ariano R, Canonica GW, Passalacqua G. Possible role of climate changes in variations in pollen seasons and allergic sensitizations during 27 years. Ann Allergy Asthma Immunol. 2010;104:215–222. doi: 10.1016/j.anai.2009.12.005. [DOI] [PubMed] [Google Scholar]
- 11.Jeong KY, Park JW, Hong CS. House dust mite allergy in Korea: the most important inhalant allergen in current and future. Allergy Asthma Immunol Res. 2012;4:313–325. doi: 10.4168/aair.2012.4.6.313. [DOI] [PMC free article] [PubMed] [Google Scholar]
- 12.Shin JW, Sue JH, Song TW, Kim KW, Kim ES, Sohn MH, et al. Atopy and house dust mite sensitization as risk factors for asthma in children. Yonsei Med J. 2005;46:629–634. doi: 10.3349/ymj.2005.46.5.629. [DOI] [PMC free article] [PubMed] [Google Scholar]
- 13.Peroni DG, Boner AL, Vallone G, Antolini I, Warner JO. Effective allergen avoidance at high altitude reduces allergen-induced bronchial hyperresponsiveness. Am J Respir Crit Care Med. 1994;149:1442–1446. doi: 10.1164/ajrccm.149.6.8004296. [DOI] [PubMed] [Google Scholar]
- 14.Google. Search News for ‘House Dust Mite’ from January 1 2001 to December 31 2010 [Internet] Mountain View: Google; 2021. [cited 2021 Apr 7]. Available from: https://www.google.com/search?q=%EC%A7%91%EB%A8%BC%EC%A7%80+%EC%A7%84%EB%93%9C%EA%B8%B0&rlz=1C1CHBD_koKR912KR912&tbs=cdr:1,cd_min:1/1/2001,cd_max:12/31/2010&tbm=nws&sxsrf=ALeKk033C5rmFGzIIiTJEbLrQ2r_gjbv1g:1617798923372&ei=C6dtYIKjFoqNr7wPoYOm-Ak&start=0&sa=N&ved=0ahUKEwjC1JTRkuzvAhWKxosBHaGBCZ84ChDy0wMIeg&biw=1330&bih=732&dpr=1.93. [Google Scholar]
- 15.Google. Search News for ‘House Dust Mite’ from January 1 2011 to December 31 2015 [Internet] Mountain View: Google; 2021. [cited 2021 Apr 7]. Available from: https://www.google.com/search?q=%EC%A7%91%EB%A8%BC%EC%A7%80+%EC%A7%84%EB%93%9C%EA%B8%B0&rlz=1C1CHBD_koKR912KR912&biw=1330&bih=732&sxsrf=ALeKk02ssvDi2M8LoNZawOmBZ1IFMPOjrg%3A1617799298735&source=lnt&tbs=cdr%3A1%2Ccd_min%3A1%2F1%2F2011%2Ccd_max%3A12%2F31%2F2015&tbm=nws . [Google Scholar]
- 16.Google. Search News for ‘House Dust Mite’ from January 1 2016 to December 31 2020 [Internet] Mountain View: Google; 2021. [cited 2021 Apr 7]. Available from: https://www.google.com/search?q=%EC%A7%91%EB%A8%BC%EC%A7%80+%EC%A7%84%EB%93%9C%EA%B8%B0&rlz=1C1CHBD_koKR912KR912&biw=1330&bih=732&sxsrf=ALeKk00idUJwhepMK9LgghLCfxO1-fIVMQ%3A1617799596932&source=lnt&tbs=cdr%3A1%2Ccd_min%3A1%2F1%2F2016%2Ccd_max%3A12%2F31%2F2020&tbm=nws. [Google Scholar]
- 17.Google. Google Trends for ‘House Dust Mite’ and ‘Allergy’ from January 1 2004 to December 31 2020 [Internet] Mountain View: Google; 2021. [cited 2021 Apr 7]. Available from: https://trends.google.com/trends/explore?date=all&geo=KR&q=%EC%A7%91%EB%A8%BC%EC%A7%80%20%EC%A7%84%EB%93%9C%EA%B8%B0,%EC%95%8C%EB%A0%88%EB%A5%B4%EA%B8%B0. [Google Scholar]
- 18.Park BW, Park JY, Cho EB, Park EJ, Kim KH, Kim KJ. Increasing prevalence of the sensitization to cat/dog allergens in Korea. Ann Dermatol. 2018;30:662–667. doi: 10.5021/ad.2018.30.6.662. [DOI] [PMC free article] [PubMed] [Google Scholar]
- 19.Gallup Korea. Pet ownership status and awareness survey in Korea. Seoul: Korea Pet Food Association; 2017. p. 58. [Google Scholar]
- 20.Custovic A, Hallam CL, Simpson BM, Craven M, Simpson A, Woodcock A. Decreased prevalence of sensitization to cats with high exposure to cat allergen. J Allergy Clin Immunol. 2001;108:537–539. doi: 10.1067/mai.2001.118599. [DOI] [PubMed] [Google Scholar]
- 21.Custovic A, Simpson BM, Simpson A, Hallam CL, Marolia H, Walsh D, et al. Current mite, cat, and dog allergen exposure, pet ownership, and sensitization to inhalant allergens in adults. J Allergy Clin Immunol. 2003;111:402–407. doi: 10.1067/mai.2003.55. [DOI] [PubMed] [Google Scholar]
- 22.García BE, Lizaso MT. Cross-reactivity syndromes in food allergy. J Investig Allergol Clin Immunol. 2011;21:162–170. [PubMed] [Google Scholar]
- 23.van Ree R, Voitenko V, van Leeuwen WA, Aalberse RC. Profilin is a cross-reactive allergen in pollen and vegetable foods. Int Arch Allergy Immunol. 1992;98:97–104. doi: 10.1159/000236171. [DOI] [PubMed] [Google Scholar]
- 24.Kim JH, Kim SA, Ku JY, Cho WK, Shin CH. Comparison of allergens and symptoms in patients with allergic rhinitis between 1990s and 2010s. Allergy Asthma Clin Immunol. 2020;16:58. doi: 10.1186/s13223-020-00455-9. [DOI] [PMC free article] [PubMed] [Google Scholar]
- 25.Park HJ, Lim HS, Park KH, Lee JH, Park JW, Hong CS. Changes in allergen sensitization over the last 30 years in Korea respiratory allergic patients: a single-center. Allergy Asthma Immunol Res. 2014;6:434–443. doi: 10.4168/aair.2014.6.5.434. [DOI] [PMC free article] [PubMed] [Google Scholar]
- 26.Kim JS, So HJ, Kim JH, Lim DH. A study on the correlation between outbreak of allergic rhinitis and airborne pollen in September. Allergy Asthma Respir Dis. 2019;7:192–198. [Google Scholar]
- 27.Reese G, Ayuso R, Lehrer SB. Tropomyosin: an invertebrate pan-allergen. Int Arch Allergy Immunol. 1999;119:247–258. doi: 10.1159/000024201. [DOI] [PubMed] [Google Scholar]
- 28.Wang J, Calatroni A, Visness CM, Sampson HA. Correlation of specific IgE to shrimp with cockroach and dust mite exposure and sensitization in an inner-city population. J Allergy Clin Immunol. 2011;128:834–837. doi: 10.1016/j.jaci.2011.07.045. [DOI] [PMC free article] [PubMed] [Google Scholar]
- 29.Silton RP, Fernández-Caldas E, Trudeau WL, Swanson MC, Lockey RF. Prevalence of specific IgE to the storage mite, Aleuroglyphus ovatus. J Allergy Clin Immunol. 1991;88:595–603. doi: 10.1016/0091-6749(91)90153-f. Erratum in: J Allergy Clin Immunol 1992;89:1062. [DOI] [PubMed] [Google Scholar]
- 30.Sarpong SB, Hamilton RG, Eggleston PA, Adkinson NF., Jr Socioeconomic status and race as risk factors for cockroach allergen exposure and sensitization in children with asthma. J Allergy Clin Immunol. 1996;97:1393–1401. doi: 10.1016/s0091-6749(96)70209-9. [DOI] [PubMed] [Google Scholar]
- 31.Kim YJ, Lee MY, Yang AR, Sol IS, Kwak JH, Jung HL, et al. Trends of sensitization to inhalant allergens in Korean children over the last 10 years. Yonsei Med J. 2020;61:797–804. doi: 10.3349/ymj.2020.61.9.797. [DOI] [PMC free article] [PubMed] [Google Scholar]
- 32.McGowan EC, Peng RD, Salo PM, Zeldin DC, Keet CA. Changes in food-specific IgE over time in the National Health and Nutrition Examination Survey (NHANES) J Allergy Clin Immunol Pract. 2016;4:713–720. doi: 10.1016/j.jaip.2016.01.017. [DOI] [PMC free article] [PubMed] [Google Scholar]
- 33.Warren CM, Brewer AG, Grobman B, Jiang J, Gupta RS. Racial/ethnic differences in food allergy. Immunol Allergy Clin North Am. 2021;41:189–203. doi: 10.1016/j.iac.2021.01.007. [DOI] [PubMed] [Google Scholar]
- 34.Laatikainen T, von Hertzen L, Koskinen JP, Mäkelä MJ, Jousilahti P, Kosunen TU, et al. Allergy gap between Finnish and Russian Karelia on increase. Allergy. 2011;66:886–892. doi: 10.1111/j.1398-9995.2010.02533.x. [DOI] [PubMed] [Google Scholar]
Associated Data
This section collects any data citations, data availability statements, or supplementary materials included in this article.
Supplementary Materials
Annual and overall positivity rates of the 10 most common allergens
Data Availability Statement
The data that support the findings of this study are available from the corresponding author upon reasonable request.