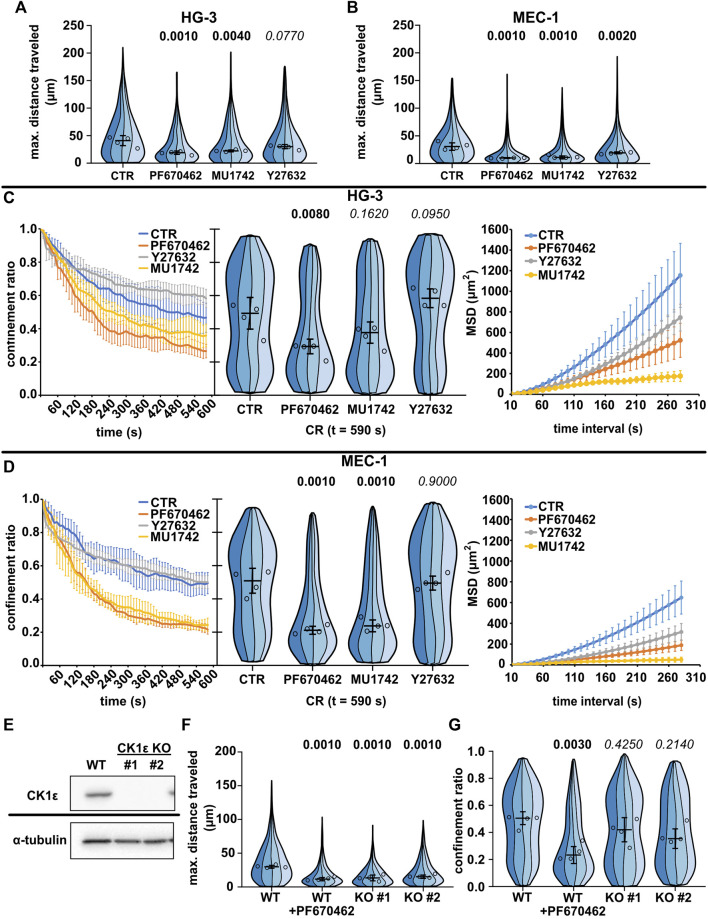
FIGURE 3.
Effects of CK1 inhibitors PF670462 and MU1742 and a ROCK inhibitor Y27632 on the basal migratory properties of the CLL cell lines. (A) Maximum distance traveled by HG-3 cells treated with 10 μM of one of the indicated inhibitors or an equal volume of DMSO (CTR). Statistics: one-way ANOVA, n = 4, p < 0.001, and the post hoc Tukey test (p values of comparison to CTR condition). (B) Maximum distance traveled by MEC-1 cells in the same experimental setup. Statistics: one-way ANOVA, n = 4, p < 0.001, and the post hoc Tukey test). (C) Analysis of HG-3 migratory persistence under the effect of CK1 and ROCK inhibitors. Left: Decay of CR over the period of tracking. Center: CR values at the last frame of the tracking period (t = 590 s). Statistics: one-way ANOVA, n = 4, p < 0.001, and the post hoc Tukey test. Right: MSD analysis. (D) Analysis of MEC-1 migratory persistence under the effects of CK1 and ROCK inhibitors. Left: decay of CR over the period of tracking. Center: CR values at the last frame of the tracking period (t = 590 s). Statistics: one-way ANOVA, n = 4, p < 0.001, and the post hoc Tukey test. Right: MSD analysis. (E) Western blot validation of the loss of expression following the CRISPR/Cas9 knockout of CK1ε in the MEC-1 cell line. α-Tubulin signal is shown as a loading control. Representative images from three biological replicates. (F) Comparison of migratory properties of two MEC-1 CK1ε KO clones to the unmutated culture (WT) using the maximum distance traveled parameter. Statistics: one-way ANOVA, n = 4, p < 0.001, and the post hoc Tukey test. (G) Comparison of the confinement ratio parameter between the CK1ε KO clones and the unmutated cell line from the same experiment. Statistics: one-way ANOVA, p = 0.004, and the post hoc Tukey test. SuperPlot setting in all panels is consistent with that described in Figure 2B. Number of cells (tracks) used for quantification in (A and C) (same experiment): CTR (103, 259, 89, 100), PF670462 (80, 77, 73, 162), MU1742 (111, 103, 166, 131), and Y27632 (103, 259, 89, 100). Number of cells (tracks) quantified in (B and D) (same experiment): CTR (141, 98, 84, 38), PF670462 (182, 87, 232, 82), MU1742 (105, 155, 166, 180), and Y27632 (115, 144, 192, 160). Number of cells (tracks quantified in (F-G) (same experiment: WT (292, 219, 399, 205), WT + PF670462 (228, 138, 239, 271), KO#1 (126, 162, 90, 299), and KO#2 (159, 229, 149, 110).

