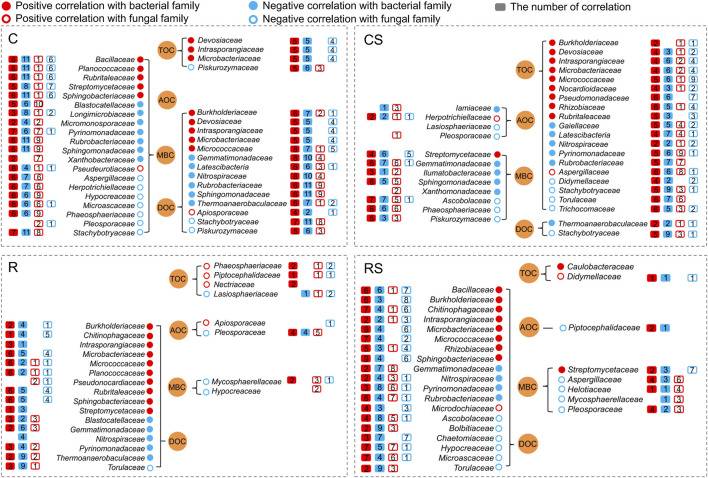
FIGURE 5.
Correlations between soil carbon fractions and microbial families (p < 0.05). Red plots indicate positive correlation; blue plots indicate negative correlation; solid plots indicate correlation with bacterial family; blank plots indicate correlation with fungal family. The number in the box plot indicates the number of correlations between the known family and other bacterial or fungal families. For example, Bacillaceae was positively correlated with six bacterial families, negatively correlated with 11 bacterial families, positively correlated with one fungal family, and negatively correlated with six fungal families under the C treatment. C: continuous maize cropping without straw retention; CS: continuous maize cropping with straw mulching; R: maize-peanut rotation without straw retention; RS: maize-peanut rotation with straw mulching.

