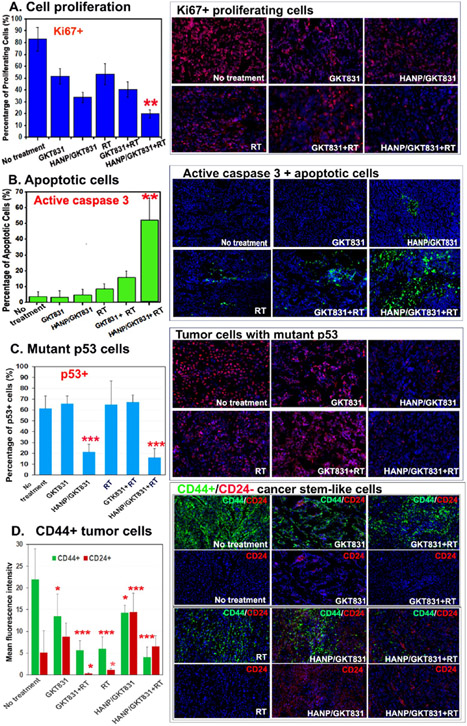
Figure 5.
Histological analysis of the effect of HANP/GKT831 and HANP/GKT831+RT on Breast PDX tumors. Frozen tissue sections of Breast VII PDX tumors collected 5 d after the last treatment were examined by immunofluorescence labeling. (A) Ki67+ proliferating cells. The bar figure showed the percentage of Ki67+ cells of Hoechst 33342 nuclear staining cells. (B) Induction of apoptotic cell death, shown as an increased level of active caspase-3 (green). (C) Inhibition of the percentage of mutant p53 tumor cells in tumors. (D) Effect of treatments on the levels of CD44 and CD24 expression in tumors. Since the levels of CD44 or CD24 expression in tumor cells, rather than the number of CD44 or CD24 positive cells, reflect the stem-like property of tumor cells, the mean fluorescence intensity of CD44 or CD24 of 6–8 images is shown. Upper images: dual CD44 (green) and CD24 (red) labeling. Lower images: CD24 labeling only. NIH ImageJ was used to quantify all images obtained under a 20× lens. The mean percentage of positive cells per image field from 4 to 6 images is shown for each group in (A–C). Student’s t-test: experimental groups vs No-treatment control, *p < 0.05; ** p < 0.01, ***p < 0.005.

