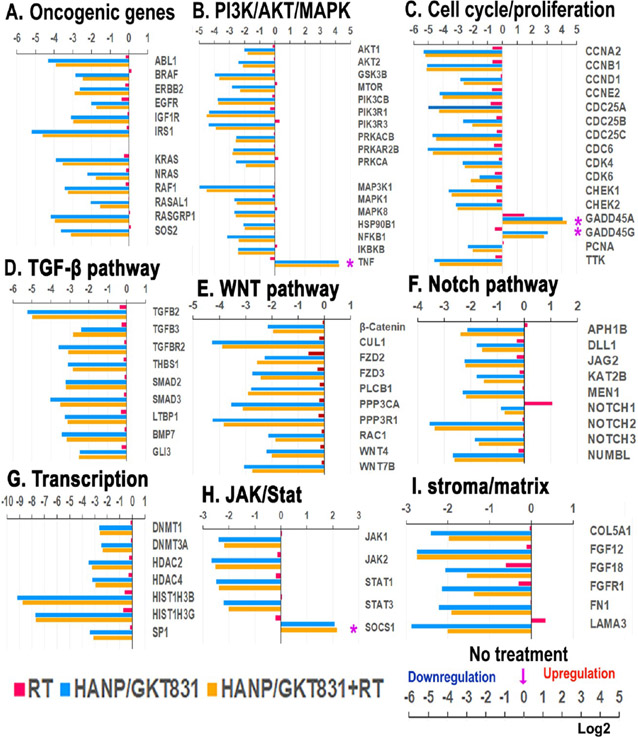
Figure 8.
Gene expression profiles of breast cancer MCF-7 cells after treatment in vitro. RNA samples isolated from MCF-7 cells after treatment with HANP/GKT831 for 24 h and 5 Gy of RT for 4 h were analyzed by Nanostring using the nCounter PanCancer Pathways Panel. Changes in the levels of representative genes in key signal pathways are shown as log2 increase or decrease compared to the values of the no-treatment control. (A) Oncogenic genes. (B) PI3k/AKT/MAPK. (C) Cell cycle/proliferation. (D) TGF-β. (E) WNT. (F) Notch. (G) Transcription regulation. (H) JAK/State. (I) Stroma/matrix. (*) Upregulation is associated with tumor growth inhibition.

