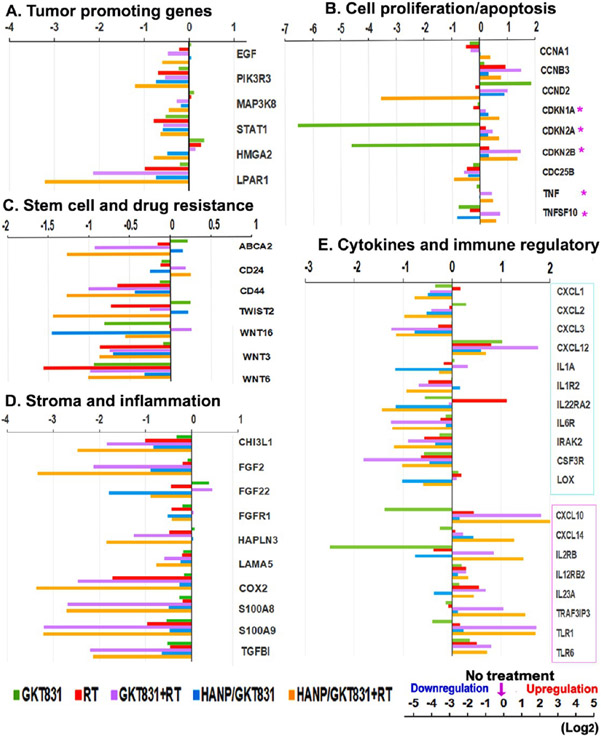
Figure 9.
Gene expression profiling of Breast VII PDX tumors after treatment. RNAs isolated from Breast VII PDX tumors collected from in vivo studies 5 d after completing a five weekly treatment schedule were analyzed by RNA-seq. The mean expression value of two PDX tumors in each group is shown as log2 increase or decrease compared to the no-treatment control. (A) Tumor-promoting genes. (B) Cell proliferation/apoptosis. (C) Stem cell and drug resistance. (D) Stroma and inflammation. (E) Cytokines and immune regulatory molecules. (*) Upregulation is associated with tumor growth inhibition. Cyan boxed: tumor-promoting and immune-suppressive cytokines and genes. Pink boxed: cytokines and genes with antitumor and immunoactivating effects.

