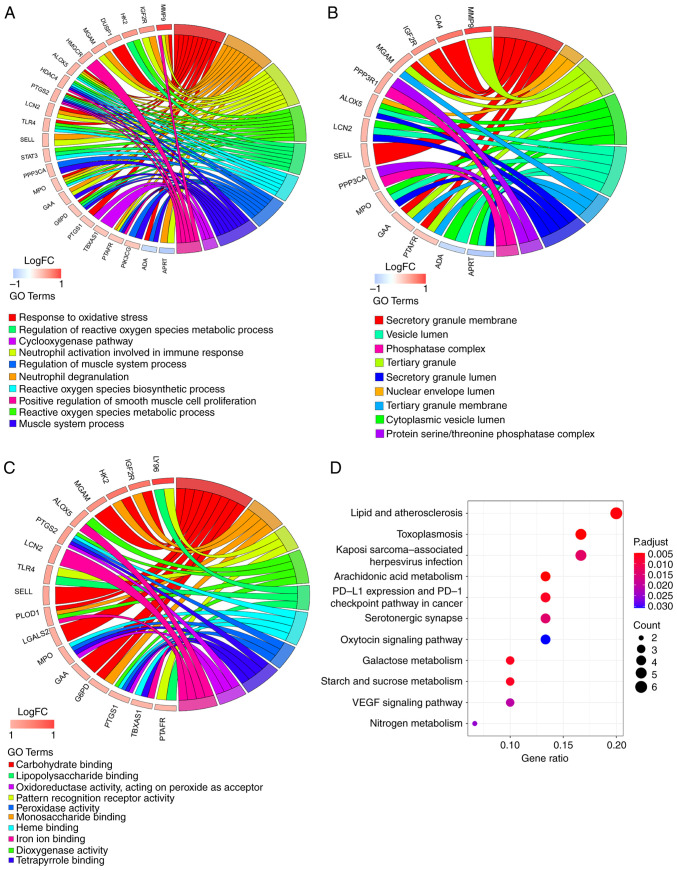
Figure 3.
Functional enrichment analysis of 32 key genes. GOChord plot of the association between selected genes and corresponding (A) biological process, (B) cellular component and (C) molecular function terms, with the logFC of the genes. Left, gene regulation; right, GO terms. A gene was linked to a specific GO term by the colored bands. (D) Dot plot of enriched pathways in 32 key genes. The color intensity, enrichment degree of KEGG pathways. Gene ratio, proportion of differential genes in the whole gene set. KEGG, Kyoto Encyclopedia of Genes and Genomes; GO, Gene Ontology; LCN2, lipocalin 2; MPO, myeloperoxidase; HK2, hexokinase 2; PTGS1, prostaglandin-endoperoxide synthase 1; LGALS2, galectin 2; LY96, lymphocyte antigen 96; PTGS1, prostaglandin-endoperoxide synthase 2: SELL, selectin L; MGAM, maltase-glucoamylase; PLOD1, procollagen-lysine, 2-oxoglutarate 5-dioxygenase; ALOX5, arachidonate 5-lipoxygenase; IGFR2, insulin-like growth factor II receptor; G6PD, glucose-6-phosphate dehydrogenase; GAA, α glucosidase; TLR4, toll-like receptor 4; PTAFR, platelet activating factor receptor; TBXAS1, thromboxane A synthase 1; FC, fold change.

