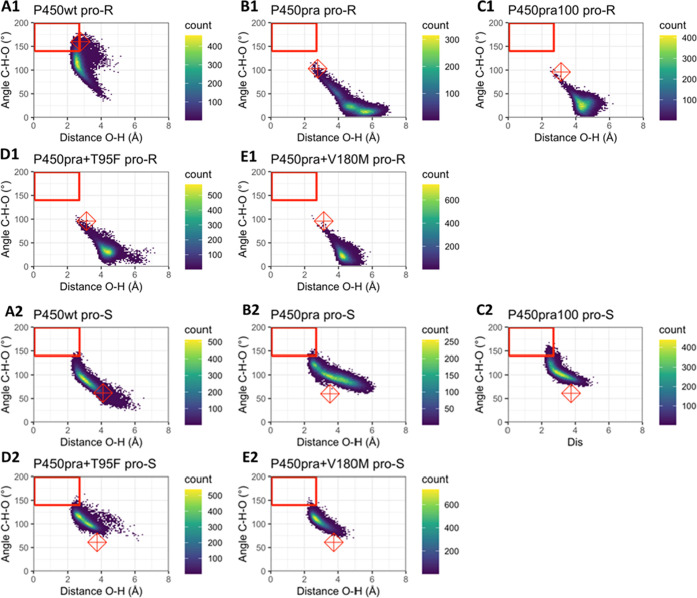
Figure 4.
Occurrence of reactive conformations of P450:compactin complexes during MD simulations. The heat maps show C–H–O angles (θ2 in Figure 2) and O–H distances (d) along 22 ns trajectories. For each enzyme–substrate complex, five MD simulations with independent seeds were used. Distances and angles were sampled with 1 ps intervals. Colors from blue to yellow show low to high numbers of frames for each substrate orientation. The red boxes indicate orientations obeying NAC criteria for both of the shown geometric criteria (d ≤ 2.7 Å; θ2 > 140°). Note that for scoring a conformation as a NAC, also the geometric criteria for the θ1 angle need to be fulfilled. Therefore, not all conformations inside the red boxes are scored as a NAC. The red diamonds show angles and distances of the initial poses. (A1–E1) Plotted angles and distances relative to the pro-R hydrogen (whose abstraction would produce the undesired 6-epi-pravastatin); (A2–E2) corresponding distances and angles for the pro-S hydrogen (abstraction would produce the desired pravastatin epimer); (A) wild-type CYP105AS1; (B) P450pra; (C) P450pra100; (D) P450pra + T95F; (E) P450pra + V180M.

