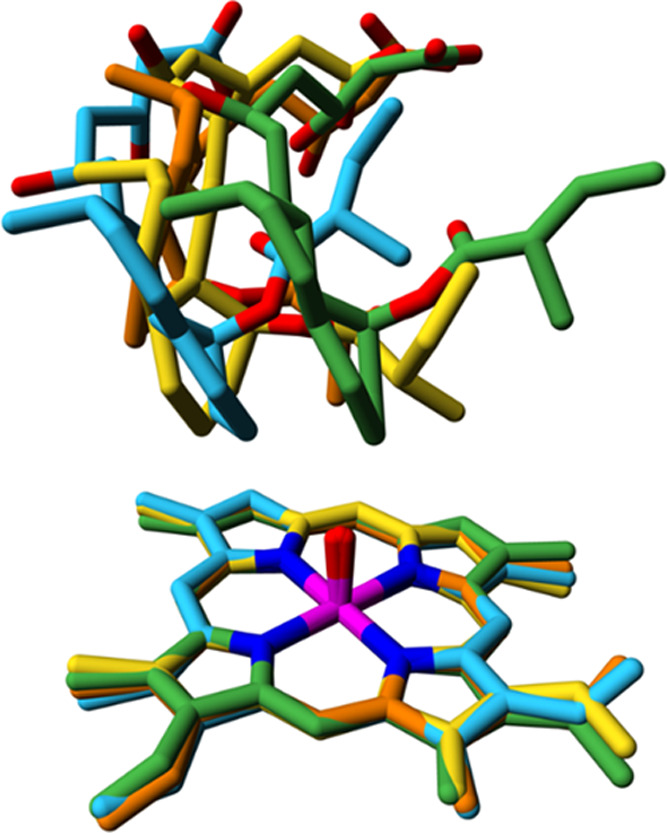
Figure 6.

Exploration of catalytically relevant conformational diversity during ps timescale MD simulations. Conformations were sampled during 50 trajectories of 100 ps of WT CYP105AS1. Shown with yellow carbon atoms is the docked orientation of the substrate, which was the starting point of each individual trajectory. The three structurally most diverse snapshots are shown with orange, green, and cyan carbon atoms. For clarity, only the substrate and part of the heme are shown. See Figure S13 for stereo pictures, the corresponding figures for the 22 ns MD simulations, and for more details.
