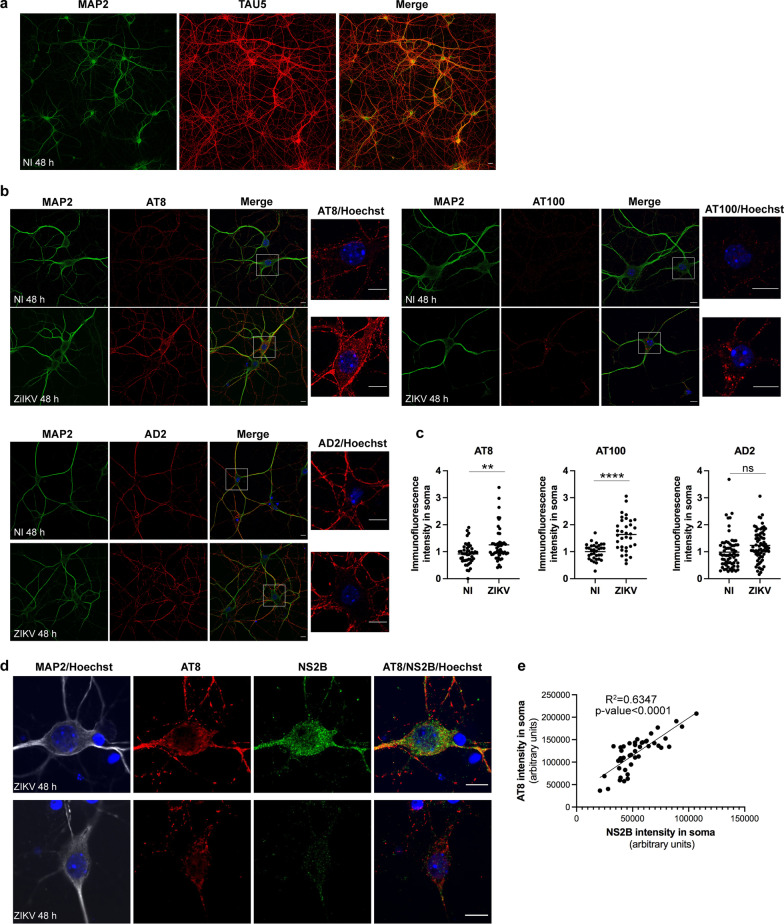
Fig. 8.
In vitro, ZIKV infection induces pTau in the absence of glial cells. PCNs from B6 embryos were either non-infected (NI) or ZIKV-infected (ZIKV) at a MOI = 5. ZIKV infection of PCNs induces pTau recognized by AT8 and AT100 antibodies 48 h p.i. predominantly in the soma of PCNs as determined by immunofluorescence and confocal microscopy with a, b nuclear DNA labeled with Hoechst (blue), the somatodendritic MAP2 protein with anti-MAP2 antibody (green), total Tau with Tau5 antibody (red) and pTau with AT8, AT100 and AD2 antibodies (red). In c the immunofluorescence intensity of pTau labeling with AT8, AT100 and AD2 antibodies in soma was quantified using ImageJ with the surface of soma determined according to MAP2 labeling while excluding dendrites. Symbols represent values normalized to NI obtained for each single cell. For AT8, n = 3 independent experiments for PBS and ZIKV conditions with 33 and 34 cells analyzed, respectively. For AT100, n = 3 independent experiments for PBS and ZIKV conditions with 48 and 50 cells analyzed, respectively. For AD2, n = 2 independent experiments for PBS and ZIKV conditions with 48 and 52 cells analyzed, respectively. Means are shown in graph with significance assessed by unpaired two-tailed Welch’s t test. P-value < 0.0001 (****), < 0.01 (**) and ns not significant. Among ZIKV-infected cells, the intensity of AT8 labeling in soma was positively correlated with the intensity of NS2B labeling as determined in d by immunofluorescence and confocal microscopy with nuclear DNA labeled with Hoechst (blue), the somatodendritic MAP2 protein with anti-MAP2 antibody (grey), pTau with the AT8 antibody (red) and the NS2B protein encoded by ZIKV with anti-NS2B antibodies (green). In e the immunofluorescence intensity of pTau and NS2B labeling in soma was quantified using ImageJ with the surface of soma determined according to MAP2 labeling while excluding dendrites. Symbols represent raw values obtained for each single cell from n = 2 independent experiment with the square of the sample Pearson correlation coefficient (R2) indicated. a, b, d Representative single confocal sections and the corresponding merge images are shown. Scale bars = 10 µm

