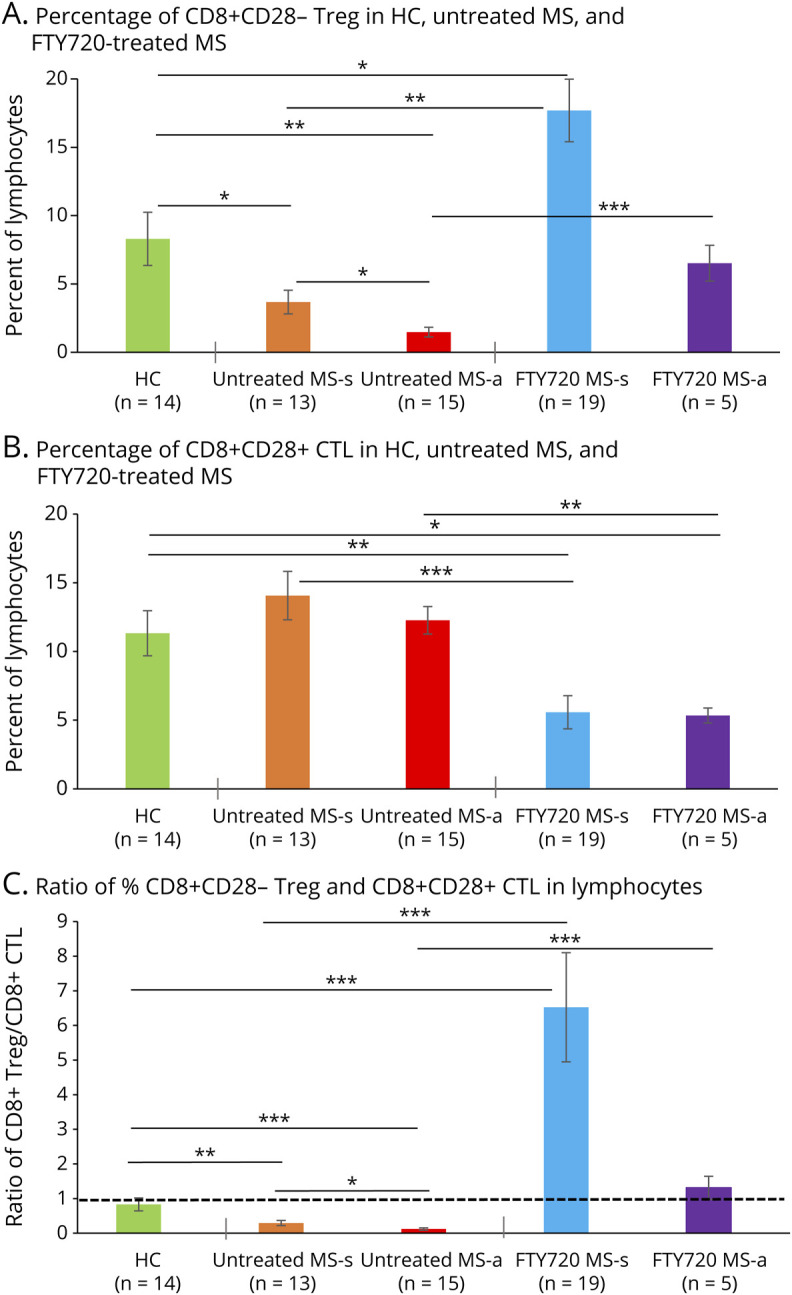
Figure 1. Fingolimod Therapy Elevates Subnormal CD8+CD28− Treg in Therapy-Naive MS to Above HC Levels.

(A) CD8+CD28− Treg as percent of lymphocytes were lower in therapy-naive stable patients with MS (3.68 ± 0.87%: p = 0.04) than in HCs (8.30 ± 1.95%) and even lower in therapy-naive exacerbating MS (1.47 ± 0.35%: p = 0.001 vs HC). Fingolimod therapy increased Treg to supranormal levels in stable MS (17.69 ± 3.10%: p = 0.002 vs therapy-naive stable) and maintained Treg at normal levels during attacks (6.52 ± 1.30%: p = 0.00004). (B) CD8+CD28+ CTL as percent of lymphocytes was greater in therapy-naive stable MS (14.06 ± 1.76%) than in fingolimod-treated stable patients (5.57 ± 1.20%: p = 0.0003). Similarly, CTLs were 12.27 ± 1.00% in therapy-naive exacerbating patients and only 5.34 ± 0.54% in fingolimod-treated exacerbating patients (p = 0.001). CTLs in HCs (11.33 ± 1.64%) were within the range of the therapy-naive stable and active MS groups. (C) Compared with HCs, the CD8+ Treg:CTL ratio was low in therapy-naive stable MS (ratio = 0.29; 0.35x of HC = 0.83) and in exacerbating patients (ratio = 0.12, 0.16x of HC). The subnormal CD8+ Treg:CTL ratio was dramatically reversed by fingolimod in stable MS (ratio = 6.52, 7.86x of HC) and in exacerbating MS (ratio = 1.31, 1.58x of HC). Flow cytometry of lymphocyte subsets. * p ≤ 0.05, ** p ≤ 0.01, *** p ≤ 0.001. Abbreviations: CTL = Cytolytic T lymphocyte; HC = healthy control; Treg = regulatory T cell.
