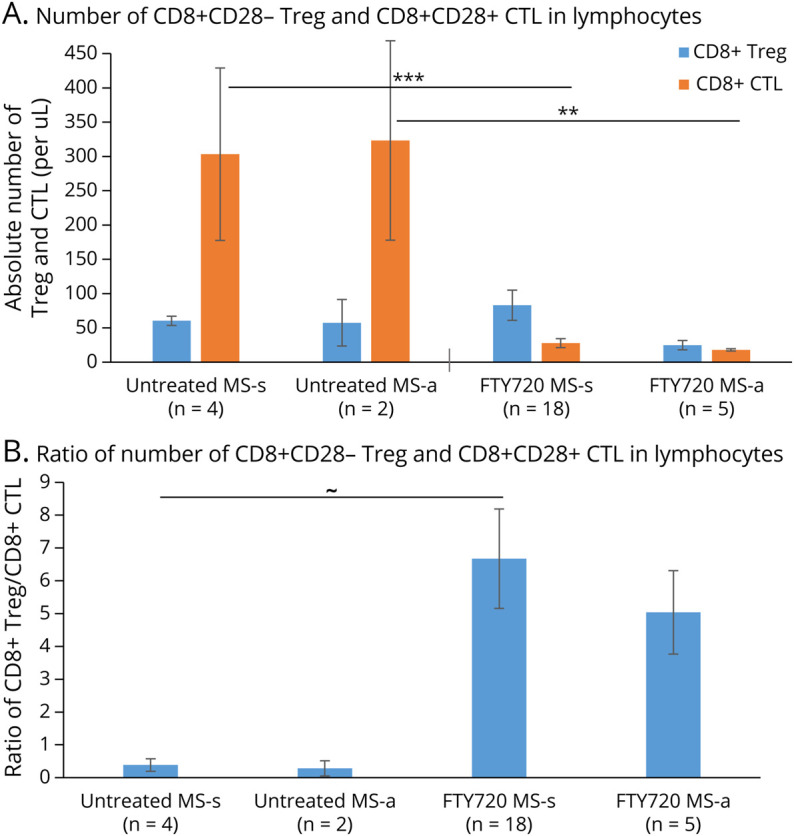
Figure 2. Fingolimod Therapy Decreases the Absolute Number of CD8+CD28+ CTL but Increases CD8+CD28− Treg In Vivo.

(A) Absolute Treg numbers were 60 cells per microliter (µL) of blood in therapy-naive stable patients with MS (MS-s) and 83 cells/uL in stable fingolimod-treated patients (NS), but fell to 25 cells/µL with exacerbations (MS-a). Absolute CD8+ CTL counts decreased from 303 cells/µL blood in therapy-naive stable MS to 28 cells/µL in fingolimod-treated stable patients (p = 0.00005) and from 323 cells/uL in therapy-naive exacerbating MS to 18 cells/uL in fingolimod-treated exacerbating patients (p = 0.01). Absolute numbers were obtained by measuring the Treg:CTL as a % of the lymphocytes from flow cytometry and multiplying this percent by the absolute lymphocyte counts obtained from clinic visits. (B) The ratio of CD8+ Treg to CD8+ CTL is low in therapy-naive MS (therapy-naive stable MS = 0.4 and therapy-naive active MS = 0.3) but is increased 16.8-fold in fingolimod-treated stable patients and 16.7-fold in fingolimod-treated active patients. ∼ = 0.06, * p ≤ 0.05, ** p ≤ 0.01, *** p ≤ 0.001. Abbreviations: CTL = Cytolytic T lymphocyte; Treg = regulatory T cell.
