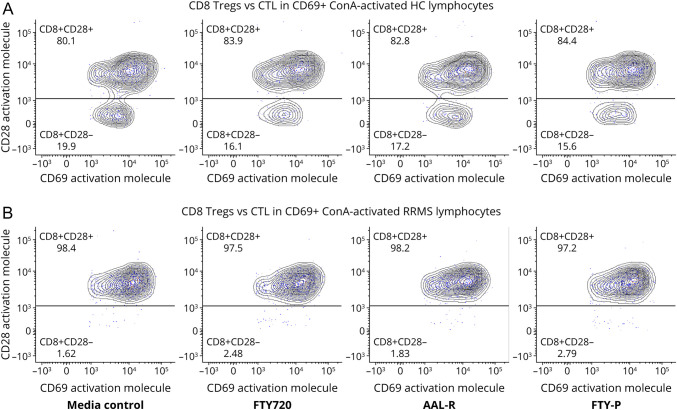
Figure 3. ConA Activation Increases CD69 Expression on CD8+CD28+ CTL More Than on CD8+CD28− Treg in HCs and Therapy-Naive RRMS.
(A) After ConA activation of HC PBMCs, the median fluorescence intensity of CD69 expression on CD8+CD28+ CTL was 4–5-fold more than on CD8+CD28− Treg, across all conditions: media control, fingolimod, the FTY720 agonists, AAL-R, and FTY-P. (B) After ConA activation of therapy-naive, exacerbating RRMS (MS-a) PBMCs, CD69 expression on CTL and Treg in across all conditions was similar to activated HC cells. However, ConA activation decreased the number of CD8+CD28− Treg in MS compared with HCs. In unstimulated lymphocytes, CD69 expression on CD8+CD28 ± cells was minimal across all conditions and groups (0.2–4%; data not shown). Representative figure of 17 experiments with stable and active MS, see Supplemental eFigure 2 (links.lww.com/NXI/A787) for gating procedure. All CD28 ± cells are CD8+ and CD69+. Abbreviations: ConA = concanavalin A mitogen; CTL = Cytolytic T lymphocyte; HC = healthy control; PBMC = peripheral blood mononuclear cell; FTY-p = FTY-phosphate; Treg = regulatory T cell.

