

Abstract
Water is essential for survival, but one in three individuals worldwide (2.2 billion people) lack access to safe drinking water. Water intake requirements largely reflect water turnover (WT), the water used by the body each day. We investigated the determinants of human WT in 5,604 people from the ages of 8 days to 96 years from 26 countries using isotope tracking (2H) methods. Age, body size, and composition were significantly associated with WT as were physical activity, athletic status, pregnancy, socioeconomic status, and environmental characteristics (latitude, altitude, air temperature, and humidity). People in countries with low human development index (HDI) had higher water turnover than people who lived in countries with high HDI. Based on this extensive dataset we provide equations to predict human water requirements in relation to anthropometric, economic, and environmental factors.
One Sentence Summary:
Measures of human water turnover from a large global database demonstrate the effects of body size, age, lifestyle, and climate.
Water is essential for life (1) and daily water intake is necessary to prevent dehydration (i.e., net loss of body water) in most terrestrial animals, including humans (2). Total body water (TBW, measured in liters) is homeostatically controlled (3) and tightly regulated day-to-day by thirst and hunger drives leading to intake of fluids and food to offset water losses (4). Body water is lost as urine, insensible transcutaneous evaporation and sweat loss, respiratory water vapor, and water in feces (Fig. 1A). To maintain water balance, these losses must be matched by intake of water from liquids (drinking water and beverages) and foods (5, 6), water vapor in respiratory air intake, transcutaneous water uptake, and water formed during aerobic respiration and metabolism (Fig. 1A) (2, 7). The total movement of water through the body, both intake and loss, is called water turnover (WT, measured in liters per day).
Fig. 1.
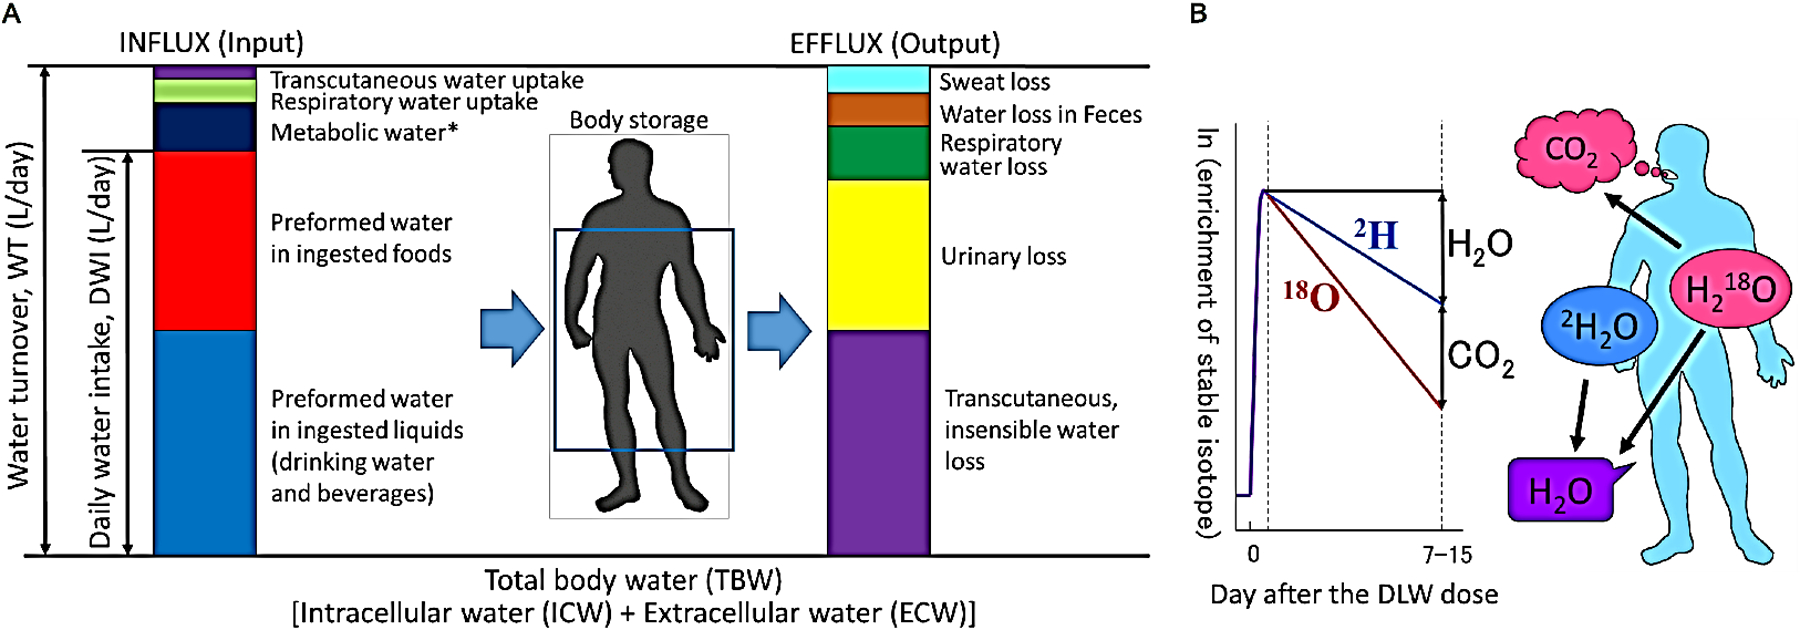
(A) Conceptual diagram showing sources of water influx and efflux on human body. * Metabolic water produced inside a living organism as an end product of the oxidation of energy-containing substances in their food. (B) Hydrogen isotope dilution and elimination provides an objective measure of total body water (TBW) and water turnover (WT). DLW; doubly labeled water.
Despite adaptations to minimize dehydration, humans can survive for only ~3 days without consuming water (1). The risk of dehydration is greater under conditions requiring increased respiration, blood circulation, and sweating, such as vigorous physical activity or in hot and humid environments (3). Insufficient water intake is a risk factor for heat stroke, urinary and kidney diseases, and cardiovascular failure (8, 9). An understanding of WT and its determinants is critical for global public health decision-making regarding the provision of drinking water and water-enriched food (10).
Public health officials need to be able to anticipate future daily water intake demands of their populations, especially during periods of impeding crisis. Ideally this would be based on scientific evidence regarding the levels of normal water intake. The current recommended intakes for water (8, 9, 11), however, rely on epidemiologic self-reported surveys or laboratory-based physiological studies with rather small sample sizes. Results obtained from self-reported intake surveys show large variation linked to imprecision in the assessment method. It is thus difficult to establish clear guidelines for worldwide public health actions from these sources of information. The majority of people who lack access to safely managed drinking water live in countries with a low human development index (HDI), but few studies have examined WT in those populations (2). To develop global guidelines for daily water intake, empirical measurements of WT under free-living conditions are required across a broad range of economic and environmental conditions.
We report WT (Fig 1) and TBW for 5,604 (3,729 females and 1875 males) people, aged between 8 days to 96 years, from 26 countries around the globe, across a wide range of environments and living conditions (Fig. S1 and Table S1). We used the hydrogen isotope dilution and elimination technique, which provides an objective, accurate, reliable, and precise measurement of both TBW and WT under free-living conditions (Fig. 1B) (7). This method involves the subject drinking ~100 ml of water enriched with ~5% deuterated water (DHO). The deuterium floods into the body water pool providing an estimate of TBW via the dilution principle (12). The excess deuterium isotope is then eliminated from the body by the elimination routes detailed in Fig 1A. Because there is no enriched isotope tracer entering the system the isotope enrichment declines exponentially back to the baseline level. The rate constant of this exponential return to baseline multiplied by the body water pool is equal to the WT.
Data were obtained from the International Atomic Energy Agency doubly labeled water (DLW) Database (13, 14). The current study aimed to examine (1) the dependence of WT and TBW on age, body size, body composition, total energy expenditure (MJ/d), and physical activity level (PAL = total energy expenditure/basal energy expenditure) through the human lifecourse, (2) the effects of climate, including latitude, altitude, outside air temperature, and humidity; and (3) the potential influence of economic development as measured by the HDI.
WT was greatest in individuals aged 20 to 30 yr in men, and from 20 to 55 yr in women (Fig. 2A and Table S2). WT was lower in men aged >40 and women aged >65. TBW was also highest for adults 20 to 40 years old (Fig. 2B). As a fraction of TBW, WT was highest in neonates (28.3 ± 7.2% per day) and decreased with age to 9.9 ± 3.0% per day in adults aged 18 to 40 years (Fig. 2C). TBW as a proportion of body weight also decreased with age, from 60.0 ± 6.4% of body weight from birth to 6 months to 50.4 ± 5.3% (males) and 42.0 ± 4.8% (females) at age 60 (Fig. 2D). Sex differences and the relationship with age and TBW in adults largely reflected variations in percent body fat, which contains less water than muscle and other organs. The ratio of WT to total energy expenditure was 0.33 ± 0.09 L/MJ (1.4 ± 0.4 ml/kcal) for adults, comparable to previous isotope-based measures (15) (Fig. 2E).
Fig. 2.
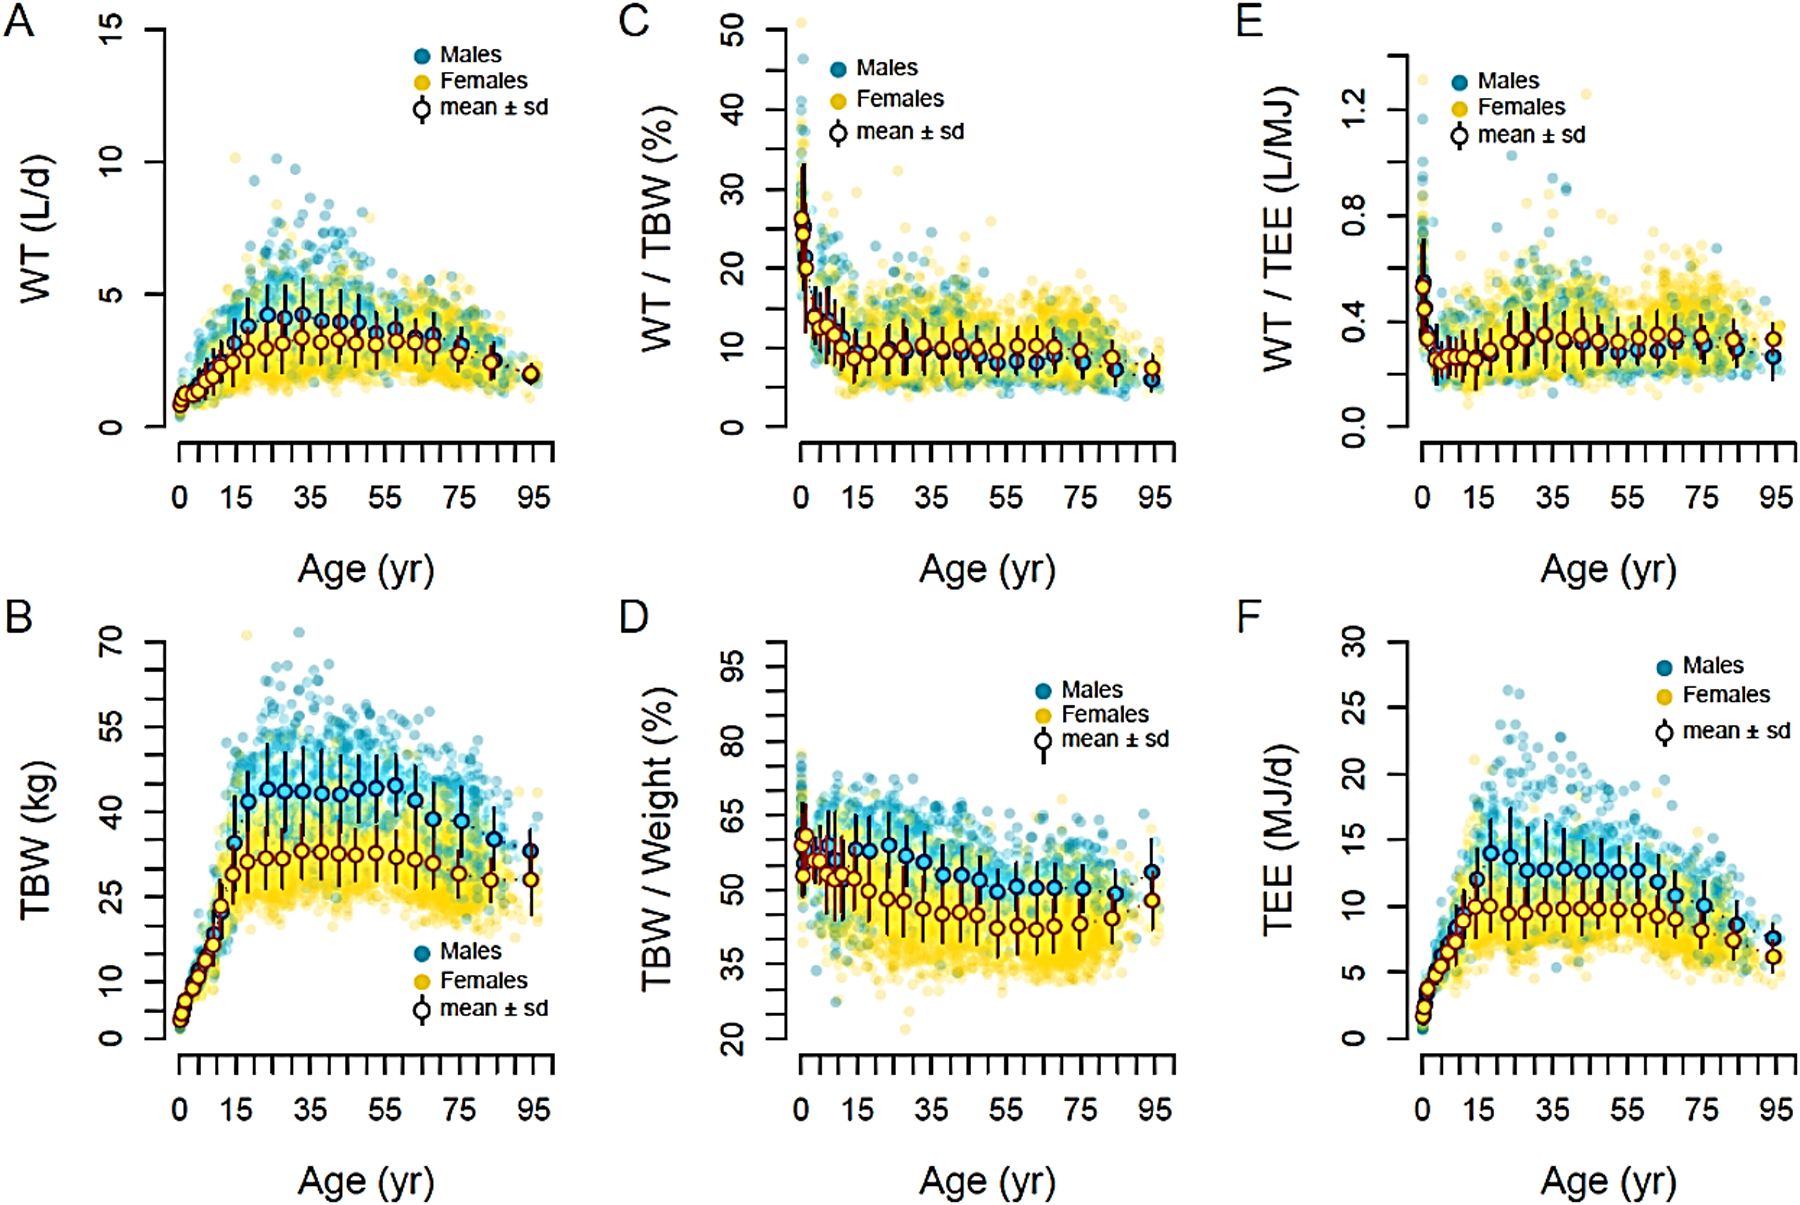
Relationships between age and total body water (TBW) or water turnover (WT) in 3729 females (orange) and 1875 males (blue) aged 0 to 96 years with mean and SD. (A) displays WT (L/d), (B) TBW (kg), (C) WT per TBW (%), (D) TBW per body weight (%), (E) WT per total energy expenditure (TEE) (L/MJ), or (F) TEE (MJ/d). Water turnover increases with age until about 30 years and is higher in men (4.3 L/d) than women (3.4 L/d). Water turnover significantly decreases after 30 years in men and 55 years in women, reaching an average water turnover of 3.1 and 2.8 L/d in men and women aged over 70 years, respectively. The average water turnover rate as a percent of total body water is a maximum of ~25% in neonates, decreases with development, and is ~15% in 5-year-old children. At puberty, water turnover falls to ~10% and remains constant until age 40 years in men and 65 years in women, after which it decreases. The average water turnover per TEE is about 0.33 L/MJ (~1.4 ml/kcal) in adults. Note that the variation in water turnover is incredibly large – the low end for men and women is ~1–1.5 L/day while the upper end is around ~6 L/day – and the outliers lie in the 10L/d range. On average, water accounts for 60% of the body weight in infants, 50% in older adults, and only 42% in women at 60 years of age, reflecting a larger % body fat.
Body size and composition, energy expenditure, and climate variables were all correlated with WT. Limiting our analysis to adults aged 18 to 60 years to avoid strong age effects (as shown in Fig. 2), bivariate analyses showed that WT was positively correlated with fat-free mass, total energy expenditure, and PAL, and negatively correlated with percent body fat (P<0.001) (Fig. 3A through D). We found a significant curvelinear relationship between outdoor air temperature and WT and a curvelinear relationship between latitude and WT (P<0.001) (Fig. 3E, F). Air temperature was positively correlated with WT when it was higher than 10 °C (P<0.001). Daily water intake was highest at approximately 0° effective latitude and the lowest at −50° or +50° latitude. People living above the Arctic Circle had higher WT than those who lived at −50° or +50° latitude.
Fig. 3.
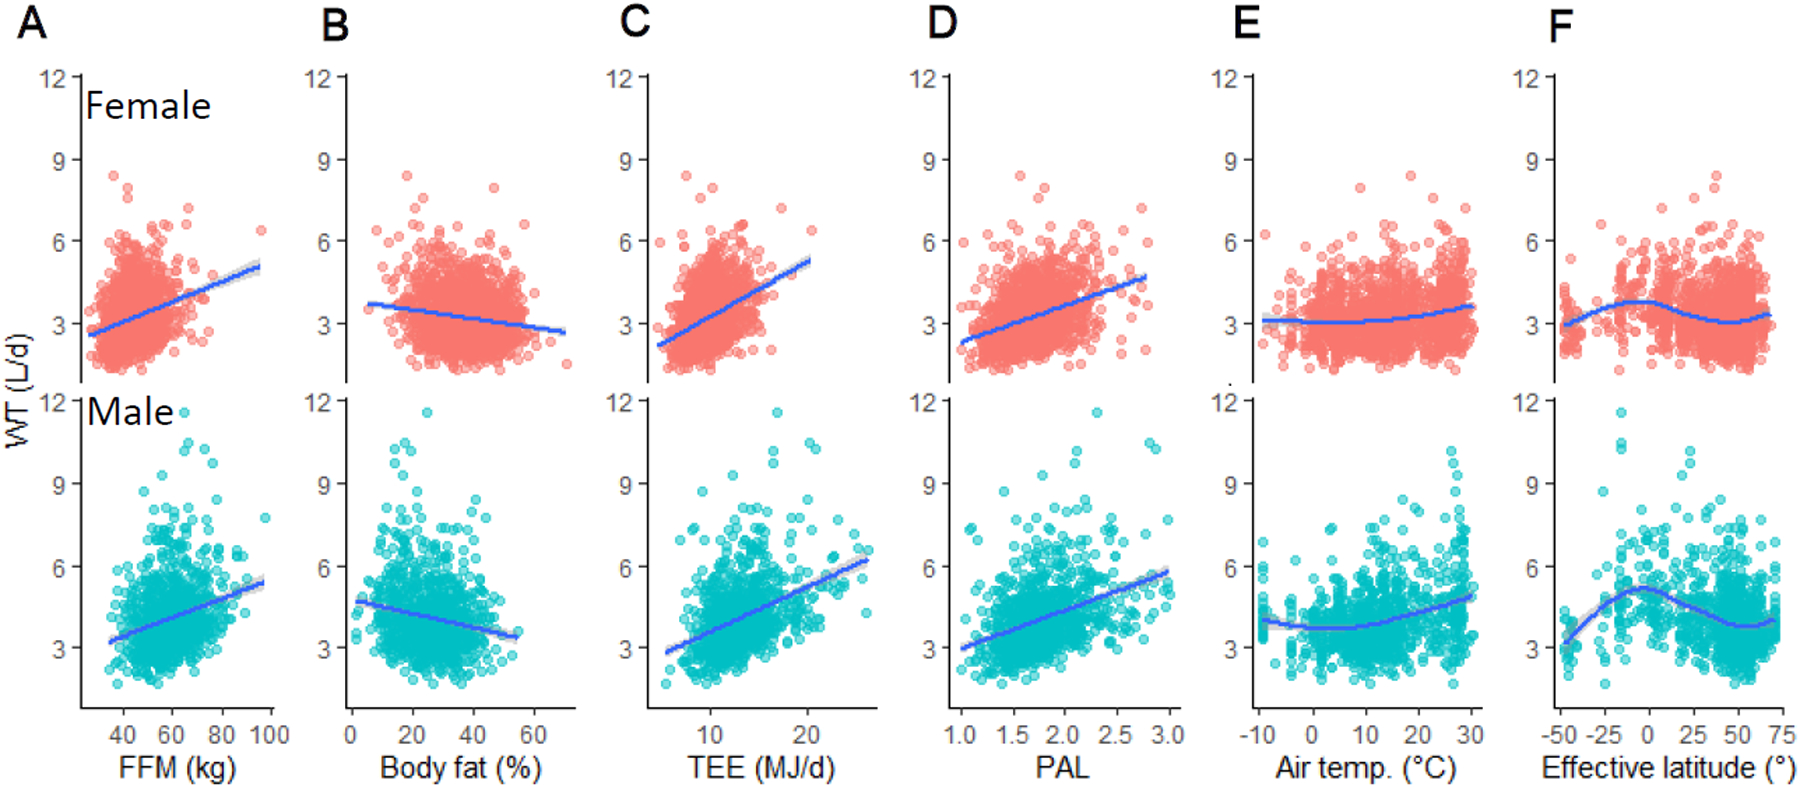
Relationships between water turnover (WT) against (A) fat-free mass (FFM), (B) percent body fat, (C) total energy expenditure (TEE), (D) physical activity level (PAL), (E) air temperature, and (F) effective latitude in 1657 females (upper panels; red) and 1013 males (lower panels; blue) aged 20 to 60 years. The blue line represents generalized additive models with integrated smoothness (GAM). Pearson correlation analysis shows positive correlations between water turnover and fat-free mass (r = 0.442, P < 0.001), TEE (r = 0.488, P < 0.001), PAL (r = 0.388, P < 0.001), and altitude (r = 0.100, P < 0.001). Water turnover was negatively correlated with percent body fat (−0.311, P < 0.001). Outdoor air temperature was only weakly correlated with water turnover in the whole sample (r = 0.160, P < 0.001). A significant curvilinear relationship between water turnover and the air temperature and a significant curvilinear relationship between water turnover and effective latitude was observed (see text for details). Average water turnover reached the highest values at around 0° and the lowest at around −50° or +50° of effective latitude. People who lived near the Arctic Circle had higher average water turnover than those who lived around −50° or +50° of effective latitude.
Linear regression analysis showed that age, fat-free mass, PAL, air temperature, relative humidity, HDI, and altitude were significant predictors of WT in adults aged 18 years and older (Table S3). We conducted multiple regression analysis (including first- and second-order polynomial terms) to examine potential non-linear relationships between WT and the above variables in adults aged 18 years and older (Table S4). The positive coefficient of the second-order term of air temperature indicated a curvilinear relationship between WT and air temperature. The negative coefficient of the second-order term of age also indicated a curvilinear relationship between WT and age. A non-linear increase of WT with increase of air temperature is predicted from the standard Scholander curve (16) for the impact of ambient temperature on metabolic rate and evaporative water loss. In an additional test of these relationships, repeated measures for 72 people in spring and summer indicated higher WT in the summer (mean air temperature of 29 °C) than in spring (mean air temperature of 18 °C) (P<0.001), whereas total energy expenditure did not differ seasonally (Fig. 4A and 4B).
Fig. 4.
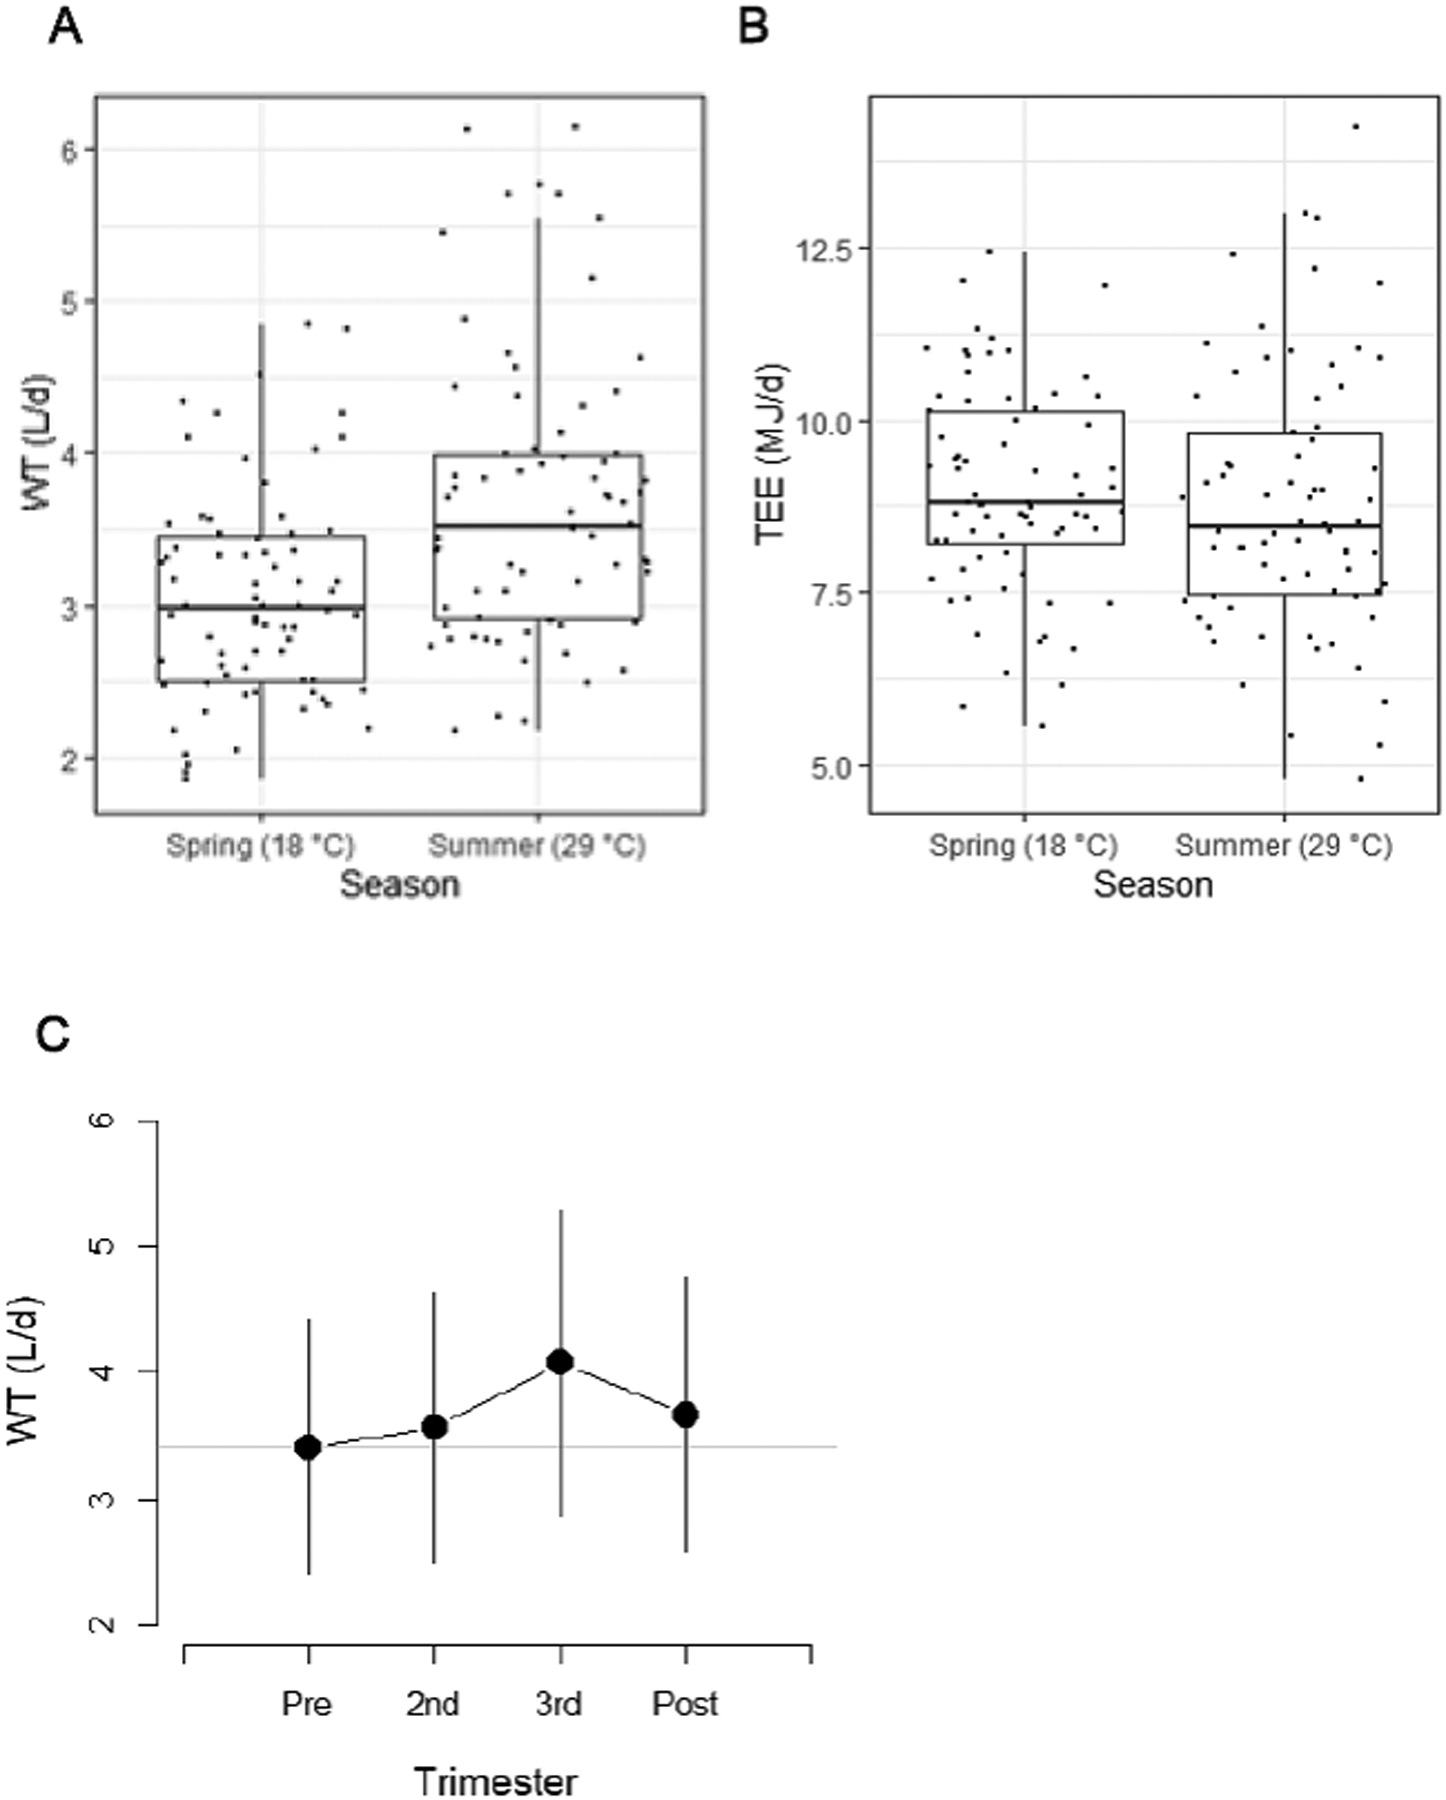
(A) Repeated measures of 72 people (31 females and 41 males) shows water turnover (WT) was significantly higher in the summer (3.7 ± 1.0 L/d) with an average temperature of 29°C than in the spring (3.0 ± 0.7 L/d) with 18°C (P < 0.001). (B) In contrast, total energy expenditure (TEE) was not significantly different between summer and spring (P = 0.233). (C) Repeated measures of 63 pregnant women show that total water turnover was significantly higher during late pregnancy and lactation (data from Butte et al. 2005). (Pre = Before pregnancy; Post = 27 weeks postpartum).
WT of pregnant and lactating women is of interest because pregnant women have higher TBW and fat-free mass than do non-pregnant women (17), and lactating women also lose water via milk production (11). Repeated measures of 63 women indicated WT increases in the third trimester of pregnancy (+670 mL/d) and during lactation (+260 mL/d) compared to pre-pregnancy (Fig. 4C) (17). The increase of WT during pregnancy is consistent with the increase in TBW.
The highest WTs in our sample are consistent with the effects of temperature, climate, physical activity and body size. Nine of the 1,875 males had high WT greater than 10 L/d; of these four were athletes, four were adult Shuar forager-horticulturalists of Amazonian Ecuador (18), and one male was Caucasian with normal BMI but measured in the summer with a maximal air temperature of 31.7 °C. Thirteen of 3,729 females had high WT greater than 7 L/d; of these five females were athletes, two females were pregnant women who had extremely high BMI (>45 kg/m2) and were measured in the summer; three females had high BMI (>30 kg/m2), in which two were measured in the summer. Three females were measured in summer, with a maximal air temperature of >30°C.
Lifestyle had clear effects on WT. Athletes had higher WT than non-athletes (P<0.001, Fig. 5A and Table S5). Hunter-gatherers, mixed farmers, and subsistence agriculturalists all had higher WT than those in industrialized economies (P<0.001, Fig. 5B and Table S6). People in countries with low HDI had higher WT than those who lived in countries with middle and high HDI, even after adjustment for physiological and environmental variables (P<0.001, Fig. 5C and Table S7). The effects of body size, PAL, and air temperature were greater for people in countries with low HDI (Fig. 4D through F). The smaller effects for these variables in high HDI populations suggests water needs are buffered against environmental influences through effective indoor climate control (e.g., air conditioning). In high HDI countries with access to air-conditioning and heating, people are exposed primarily to a narrow indoor temperature in range (18 to 25 °C) (19). By comparison, people living in low HDI countries are more likely to be exposed to ambient environmental temperatures without climate control. This view is consistent with greater size-adjusted WT for hunter-gatherers and manual laborers when compared to sedentary adults in industrialized countries (2). Similarly, a previous comparison of regional water use (20) noted that water use is relatively high in Africa and relatively low in Europe, and results from our analysis may help to explain why.
Fig. 5.
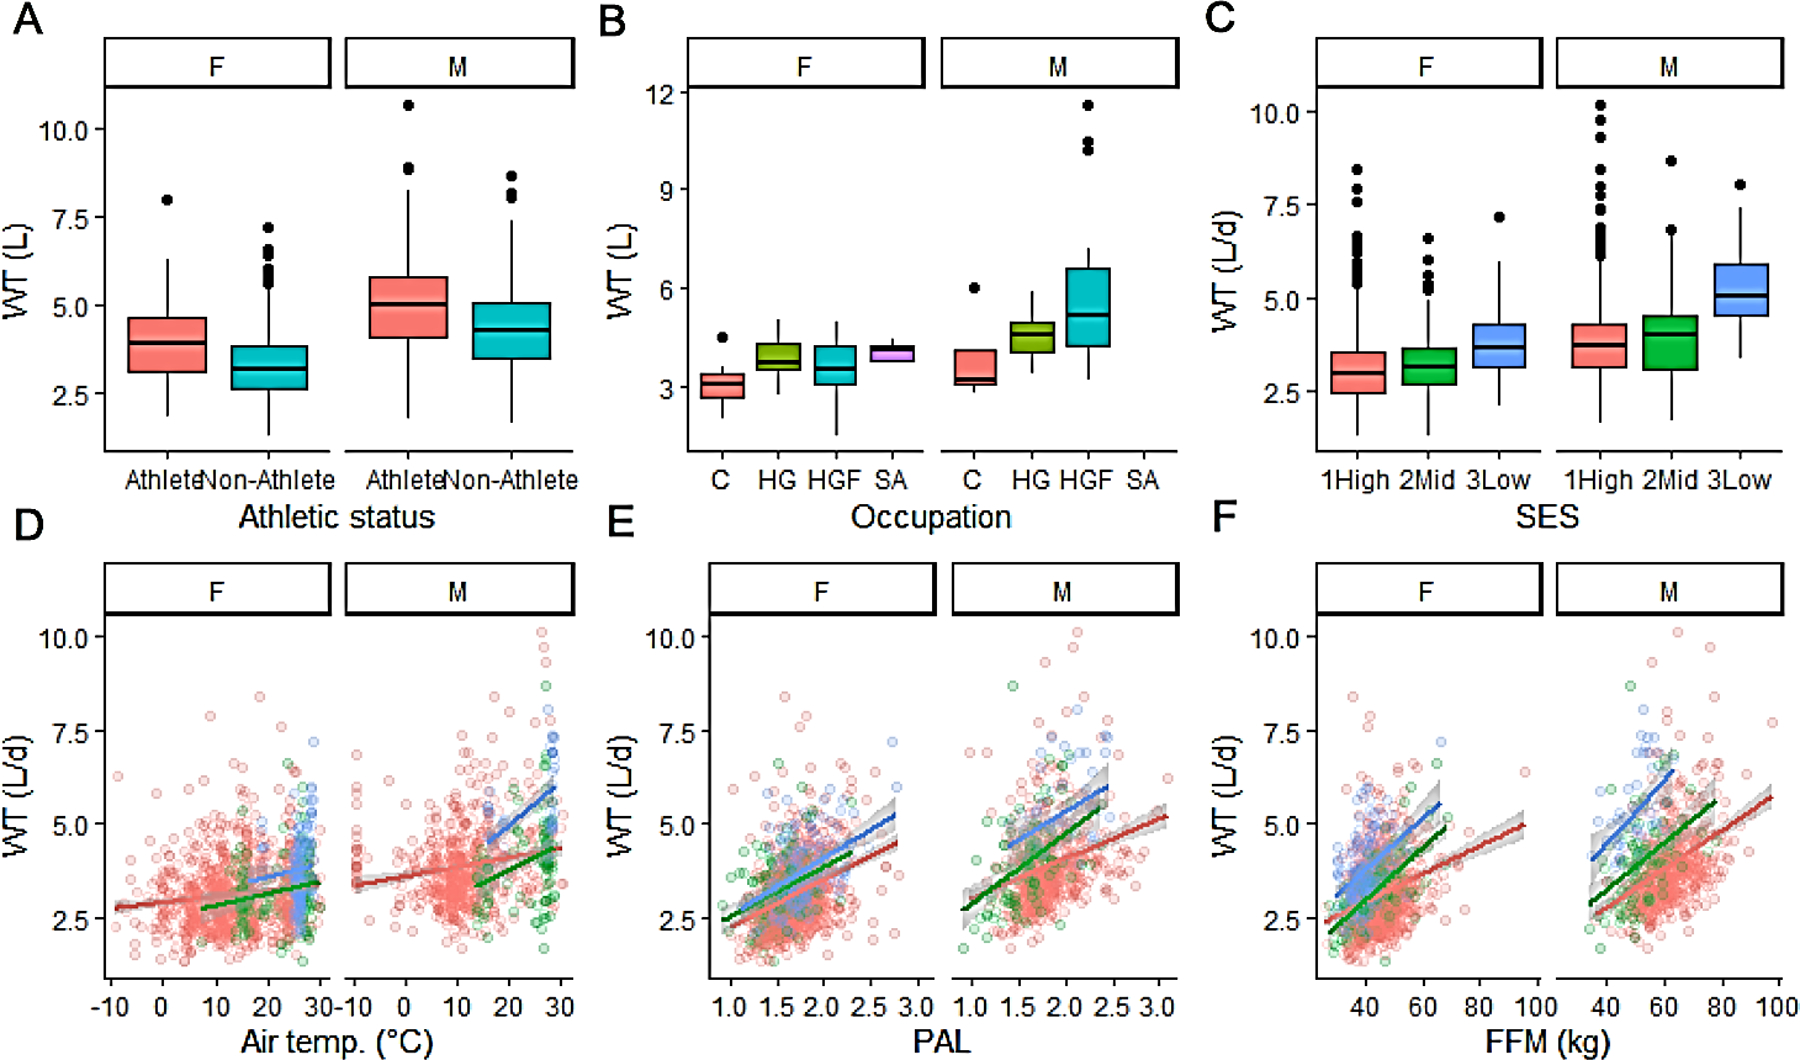
(A) Athletes had higher water turnover (WT) than non-athletes, even after adjusting for physiological and environmental variables (P < 0.001). (B) Hunter-gatherers (HG), mixed farmer and hunter-gatherer (HGF), and subsistence agriculturalists (SA) had higher water turnover than other people (C), even after adjusting for physiological and environmental variables (P < 0.001). Note that there are no males in the database who fell into the SA category. (C) People who lived in countries with a low Human Development Index (HDI) had higher WT than people who lived in countries with high or middle HDI, even after adjusting for physiological and environmental variables (P < 0.001). (D-F) Relationship between water turnover and outdoor air temperature, physical activity level (PAL), or fat-free mass. The countries were categorized as high (red), middle (green), and low (blue) HDI. (D) A significant interaction (P < 0.001) was observed between outdoor air temperature and HDI in water turnover. The association between outdoor air temperature and water turnover is weak in high HDI countries (r = 0.086, P < 0.001) but strong in men in low HDI countries (r = 0.604, P < 0.001). (E, F) A significant interaction (P < 0.001) was observed between HDI and PAL or FFM in water turnover. Correlation coefficients were significantly higher (P < 0.001) in low HDI countries (r = 0.484 to 0.670, P < 0.001) than in high HDI countries (r = 0.367 to 0,510, P < 0.001).
We obtained the following equation to predict WT (Fig. 6):
| [eq.1] |
Sex is 0 for female and 1 for male; Athlete status is 0 for non-athlete and 1 for athlete; HDI is 0 for high HDI countries, 1 for middle HDI countries, and 2 for low HDI countries. This equation explains 47.1% of the variation in WT. An increase in PAL of 1.0 induces a ~1000 ml increase in WT; a 50 kg increase in body weight induces a ~700 ml increases in WT; a 50% increase in relative humidity induces a ~300 ml increase in WT; and a 1000 m increase in altitude induces a ~500 ml increase in WT. Males exhibit ~400 ml more WT than do females of the same weight because males have greater fat-free mass and a lower percentage body fat. People who live in low HDI countries exhibit ~200 ml more WT than people who live in high HDI countries after controlling for the other measured variables. Athletes have ~1000 ml more WT than do non-athletes with everything else being equal. A U-shaped relationship between WT and air temperature shows ~1000 ml more WT at +30 °C air temperature than the nadir between ±0 and +10 °C air temperature, and also ~400 ml more WT at −10 °C air temperature than that nadir. A curvilinear relationship between WT and age shows the peak WT is shown between 20’s and 40’s and decrease after 50’s and ~700 ml less WT at age 80 than at age 30.
Fig. 6.
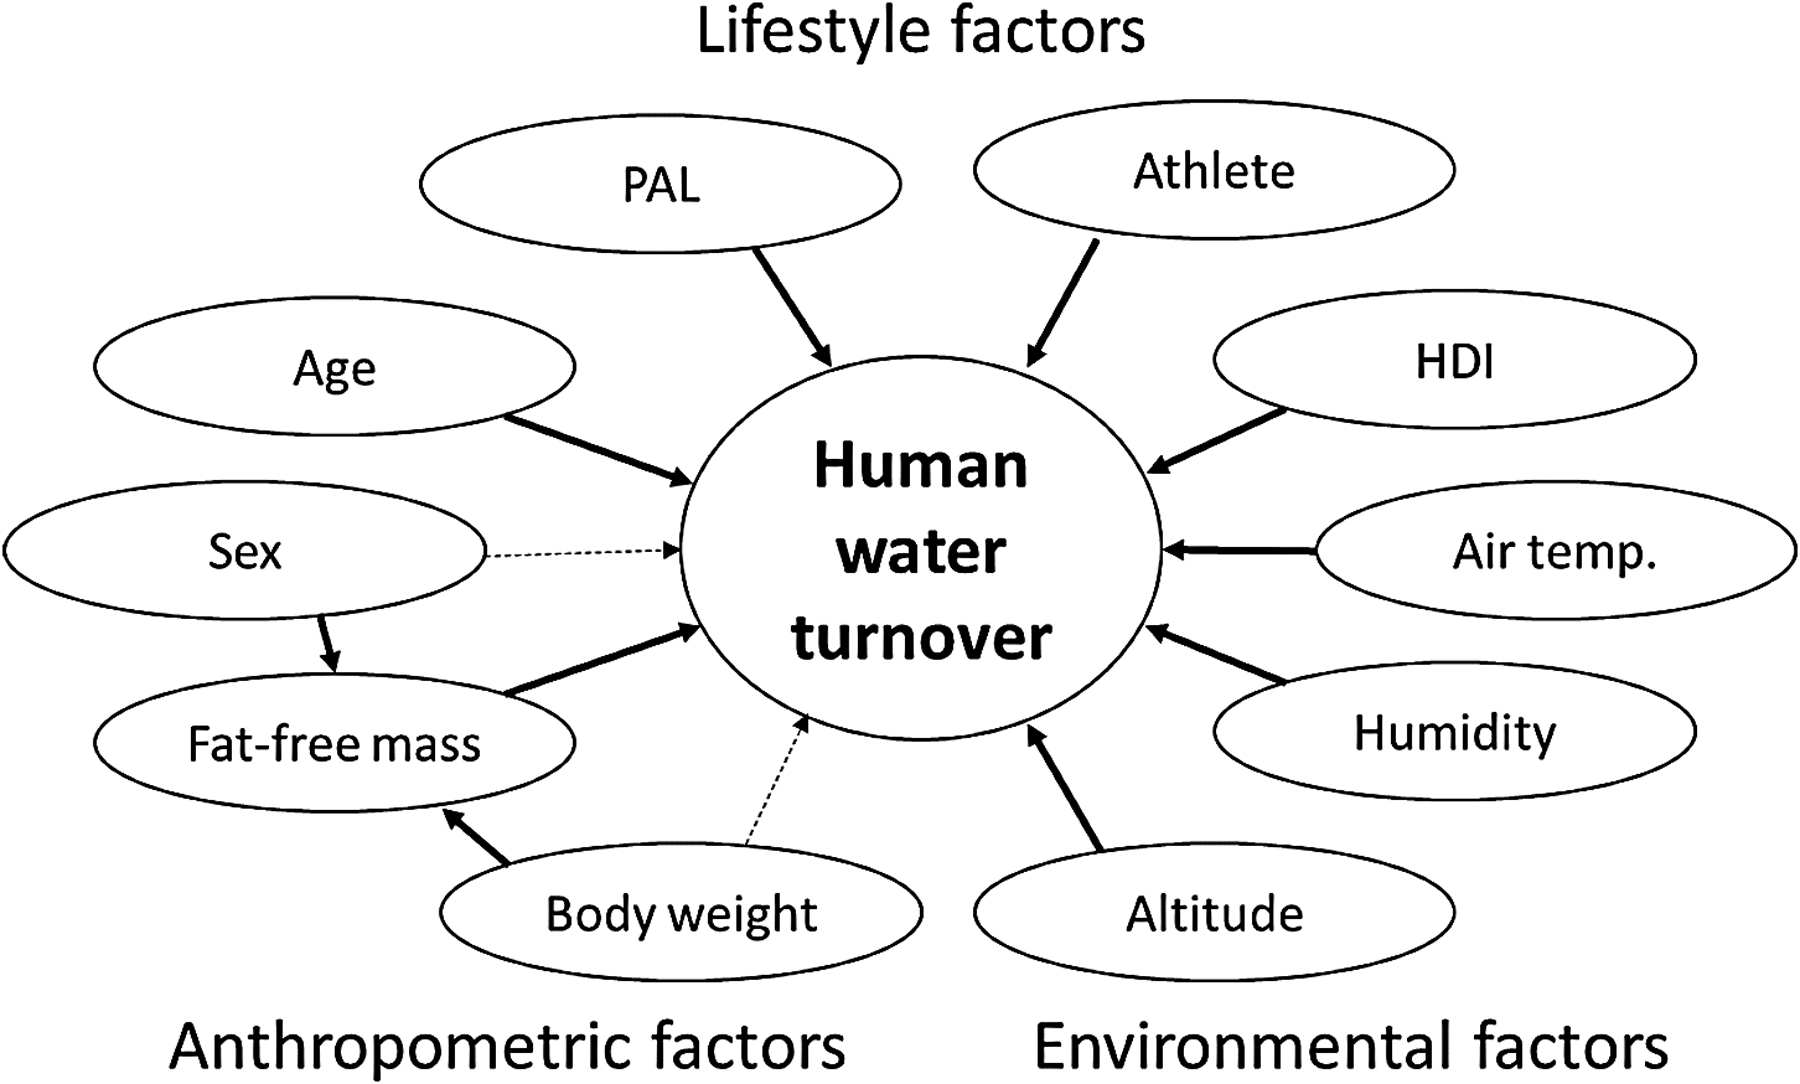
Determinants of human water turnover. Objective measures of water turnover from a large global dataset indicate that water turnover is strongly related to anthropometric, lifestyle, and environmental factors. PAL = Physical activity level (Total energy expenditure/Basal energy expenditure), HDI = Human development index.
A 20-year-old male weighing 70 kg, who is not athletic and exhibits a PAL of 1.75, and who lives in a high HDI country at 0 m altitude where mean air temperature is 10°C and relative humidity is 50%, has a predicted WT of 3.2 L/d. A non-athletic 20-year-old female weighing 60 kg living at the same location will have a WT of 2.7 L/d. In contrast, a 20-year-old athletic male weighing 70 kg, with a PAL of 2.5, who lives in a high HDI country at a location 2000 m above sea level, where air temperature is 30°C and relative humidity is 90%, has a WT of 7.3 L/d; for a 60 kg athletic female in the same scenario, WT is 6.8 L/d. In this equation, we used weight and sex as a proxy of fat-free mass because body composition is not easily measured in daily setting. If body composition can be assessed, the following equation can be used to predict WT (Fig. 6):
| [eq.2] |
TEE was not included into the equations because sex, body weight or PAL capture the variance explained by TEE. When fat-free mass was included in the model, the effect of sex was not significant. The sex difference of WT can be explained by the sex difference of the fat-free mass/body weight ratio.
Values of WT in this study represented average values under normal conditions. Many health conditions, including parasitic infections and diarrhea, affect water loss and intake (21). Additionally, the current study did not assess any indicators of hydration status and did not indicate whether the participants were adequately hydrated. Older adults or vulnerable individuals have a higher risk of both acute and chronic dehydration (22, 23) because they have a decreased thirst response. Medications, anorexia or frailty, and low TBW (storage) are associated with a lower skeletal muscle mass (i.e., sarcopenia). Skeletal muscle tissues contain a large volume of water, particularly in the intracellular space (24). Mean WT values presented here are not necessarily representative of all people or conditions (21) but provide a comparative framework for investigating water intakes in populations with greater needs.
Objective measures of WT from a large global dataset indicate that WT is strongly related to anthropometric, lifestyle, and environmental factors. We found significant correlations between WT and several known markers of health, wellness, and disease risks: WT is positively correlated with fat-free mass, TEE, PAL, athletic status, and negatively correlated with percent body fat and age in adults. WT may therefore provide a useful, integrative biomarker of metabolic health. Biomarkers that capture global metabolic health are generally lacking and of potentially enormous value for public health and medical management.
As shown in Figure 1, we need to be aware that WT obtained by the hydrogen isotope dilution and elimination technique is not equal to daily water intake from liquids and foods. Metabolic water accounts for ~10% of WT, and respiratory water uptake and transcutaneous water uptake each account for 2 to 3% of WT. Therefore, daily water intake from liquids and foods is equivalent to ~85% of WT (7). An unsolved question is, what percentage of water intake comes from food? Self-reported surveys around the world suggested 20–50% of daily water intake is from food (5, 6, 11). These estimates, however, are questionable because many studies that have demonstrated self-reported surveys underestimate energy, protein and salt intake. Thus, dietary survey methods probably also underestimate the water intake in food and overestimate from drinking water and beverages. Conversely, if people consume a higher energy density diet with lower water content (25, 26), they may need more water from drinks and beverages. Without measured water intakes from food, it is not possible to assess the relative contributions of food and drinking water or beverages to WT in this study, and indeed no studies to date have adequately addressed this issue. Nonetheless, the current study clearly indicates that one size does not fit all for drinking water guidelines, and the common suggestion that we should drink 8 × 8oz glasses of water per day (approx. 2 L) is not backed by objective evidence.
We provide equations to predict human WT by environmental, lifestyle and anthropometric factors guided by a large dataset. Improved guidelines are of increasing importance because of the explosive population growth and climate change the world currently faces, which will affect the availability of water for human consumption (27, 28) and non-ingestive uses, such as irrigation, cooling, and manufacturing (29). Presently, 2.2 billion people lack access to safe drinking water (30). The WT measures here can help shape strategies for drinking water and water-enriched food management as the global population and climate changes.
Supplementary Material
Acknowledgments
We are grateful to the International Atomic Energy Agency (IAEA), Taiyo Nippon Sanso, and SERCON for their support and to Takashi Oono for his tremendous efforts at fundraising on our behalf. Y.Y. and M.K. would like to pay gratitude and respect to their mentor, Prof. Taketoshi Morimoto, an emeritus professor of the Department of Physiology, Kyoto Prefectural University of Medicine, who passed away in July 2019. Y.Y., T.Y., and M.M. are grateful to Keiichi Abe for his support.
Funding:
The IAEA Doubly Labeled Water (DLW) Database is generously supported by the IAEA, Taiyo Nippon Sanso, and SERCON. The authors also gratefully acknowledge funding from the US National Science Foundation (BCS-1824466) awarded to H.P. and the Chinese Academy of Sciences (grant CAS 153E11KYSB20190045) to J.R.S. The funders played no role in the content of this manuscript.
Footnotes
See the supplementary materials.
Conflict of interest: Y.Y. has a patent pending that is partly related to the publication. The other authors have no conflicts of interest to declare.
Data Availability:
All data used in these analyses were freely available via the IAEA DLW Database, which can be found at https://doubly-labelled-water-database.iaea.org/home and www.dlwdatabase.org.
References
- 1.Popkin BM, D’Anci KE, Rosenberg IH, Water, hydration, and health. Nutr Rev 68, 439–458 (2010). [DOI] [PMC free article] [PubMed] [Google Scholar]
- 2.Pontzer H et al. , Evolution of water conservation in humans. Current biology : CB 31, 1804–1810.e1805 (2021). [DOI] [PubMed] [Google Scholar]
- 3.Morimoto T, Itoh T, Thermoregulation and body fluid osmolality. J Basic Clin Physiol Pharmacol 9, 51–72 (1998). [DOI] [PubMed] [Google Scholar]
- 4.Zimmerman CA et al. , Thirst neurons anticipate the homeostatic consequences of eating and drinking. Nature 537, 680–684 (2016). [DOI] [PMC free article] [PubMed] [Google Scholar]
- 5.Rosinger A, Tanner S, Water from fruit or the river? Examining hydration strategies and gastrointestinal illness among Tsimane’ adults in the Bolivian Amazon. Public Health Nutr 18, 1098–1108 (2015). [DOI] [PMC free article] [PubMed] [Google Scholar]
- 6.Tani Y et al. , The influence of season and air temperature on water intake by food groups in a sample of free-living Japanese adults. Eur J Clin Nutr 69, 907–913 (2015). [DOI] [PubMed] [Google Scholar]
- 7.Raman A et al. , Water turnover in 458 American adults 40–79 yr of age. American journal of physiology. Renal physiology 286, F394–401 (2004). [DOI] [PubMed] [Google Scholar]
- 8.Johnson RJ et al. , Metabolic and Kidney Diseases in the Setting of Climate Change, Water Shortage, and Survival Factors. Journal of the American Society of Nephrology : JASN 27, 2247–2256 (2016). [DOI] [PMC free article] [PubMed] [Google Scholar]
- 9.Glaser J et al. , Climate Change and the Emergent Epidemic of CKD from Heat Stress in Rural Communities: The Case for Heat Stress Nephropathy. Clinical journal of the American Society of Nephrology : CJASN 11, 1472–1483 (2016). [DOI] [PMC free article] [PubMed] [Google Scholar]
- 10.Gleick PH, Water strategies for the next administration. Science 354, 555–556 (2016). [DOI] [PubMed] [Google Scholar]
- 11.Food and Nutrition Board, Institute of Medicine, Dietary Reference Intakes for Water, Potassium, Sodium, Chloride, and Sulfate., (National Academies Press, Washington, DC, 2005). [Google Scholar]
- 12.International Atomic Energy Agency, IAEA Human Health Series No. 3. Assessment of Body Composition and Total Energy Expenditure in Humans Using Stable Isotope Techniques. (Vienna International Centre, Vienna, Austria, 2009). [Google Scholar]
- 13.Speakman JR et al. , A standard calculation methodology for human doubly labeled water studies. Cell reports. Medicine 2, 100203 (2021). [DOI] [PMC free article] [PubMed] [Google Scholar]
- 14.Pontzer H et al. , Daily energy expenditure through the human life course. Science 373, 808–812 (2021). [DOI] [PMC free article] [PubMed] [Google Scholar]
- 15.Westerterp KR, Plasqui G, Goris AH, Water loss as a function of energy intake, physical activity and season. Br J Nutr 93, 199–203 (2005). [DOI] [PubMed] [Google Scholar]
- 16.Scholander PF, Hock R, Walters V, Johnson F, Irving L, Heat regulation in some arctic and tropical mammals and birds. The Biological bulletin 99, 237–258 (1950). [DOI] [PubMed] [Google Scholar]
- 17.Butte NF, Wong WW, Treuth MS, Ellis KJ, O’Brian Smith E, Energy requirements during pregnancy based on total energy expenditure and energy deposition. Am J Clin Nutr 79, 1078–1087 (2004). [DOI] [PubMed] [Google Scholar]
- 18.Christopher L et al. , High energy requirements and water throughput of adult Shuar forager-horticulturalists of Amazonian Ecuador. American journal of human biology : the official journal of the Human Biology Council, e23223 (2019). [DOI] [PubMed] [Google Scholar]
- 19.Zhang X et al. , Human total, basal and activity energy expenditures are independent of ambient environmental temperature. iScience 25, 104682 (2022). [DOI] [PMC free article] [PubMed] [Google Scholar]
- 20.Pande S, Pandit A, Hydro-social metabolism: scaling of birth rate with regional water use. Palgrave Communications 4, 85 (2018). [Google Scholar]
- 21.Rosinger AY, Biobehavioral variation in human water needs: How adaptations, early life environments, and the life course affect body water homeostasis. American journal of human biology : the official journal of the Human Biology Council 32, e23338 (2020). [DOI] [PubMed] [Google Scholar]
- 22.El-Sharkawy AM et al. , Hydration and outcome in older patients admitted to hospital (The HOOP prospective cohort study). Age Ageing 44, 943–947 (2015). [DOI] [PMC free article] [PubMed] [Google Scholar]
- 23.Maughan RJ, Hydration, morbidity, and mortality in vulnerable populations. Nutr Rev 70 Suppl 2, S152–155 (2012). [DOI] [PubMed] [Google Scholar]
- 24.Yamada Y et al. , Extracellular Water May Mask Actual Muscle Atrophy During Aging. The Journals of Gerontology Series A: Biological Sciences and Medical Sciences 65A, 510–516 (2010). [DOI] [PubMed] [Google Scholar]
- 25.Drewnowski A, Energy Density, Palatability, and Satiety: Implications for Weight Control. Nutrition Reviews 56, 347–353 (1998). [DOI] [PubMed] [Google Scholar]
- 26.Ledikwe JH et al. , Dietary energy density is associated with energy intake and weight status in US adults. The American Journal of Clinical Nutrition 83, 1362–1368 (2006). [DOI] [PubMed] [Google Scholar]
- 27.UNESCO World Water Assessment Programme, The United Nations world water development report 2020: water and climate change. (2020).
- 28.Woodward G, Perkins DM, Brown LE, Climate change and freshwater ecosystems: impacts across multiple levels of organization. Philos Trans R Soc Lond B Biol Sci 365, 2093–2106 (2010). [DOI] [PMC free article] [PubMed] [Google Scholar]
- 29.Jaramillo F, Destouni G, Local flow regulation and irrigation raise global human water consumption and footprint. Science 350, 1248–1251 (2015). [DOI] [PubMed] [Google Scholar]
- 30.Stats UN, Sustainable Development Goals. (2019).
- 31.Speakman JR et al. , The International Atomic Energy Agency International Doubly Labelled Water Database: Aims, Scope and Procedures. Annals of Nutrition and Metabolism 75, 114–118 (2019). [DOI] [PubMed] [Google Scholar]
- 32.International Atomic Energy Agency. (Vienna, Austria, 2019), vol. 2020. [Google Scholar]
- 33.Speakman JR, Doubly labelled water: theory and practice. (Chapman and Hall, London, 1997). [Google Scholar]
- 34.Schoeller DA et al. , Energy expenditure by doubly labeled water: validation in humans and proposed calculation. Am J Physiol Regul Integr Comp Physiol 250, R823–830 (1986). [DOI] [PubMed] [Google Scholar]
- 35.Wong WW, Clarke LL, A hydrogen gas-water equilibration method produces accurate and precise stable hydrogen isotope ratio measurements in nutrition studies. J Nutr 142, 2057–2062 (2012). [DOI] [PMC free article] [PubMed] [Google Scholar]
- 36.Ripoche N, Ferchaud-Roucher V, Krempf M, Ritz P, D and 18O enrichment measurements in biological fluids in a continuous-flow elemental analyser with an isotope-ratio mass spectrometer using two configurations. Journal of mass spectrometry : JMS 41, 1212–1218 (2006). [DOI] [PubMed] [Google Scholar]
- 37.Westerterp KR, Doubly labelled water assessment of energy expenditure: principle, practice, and promise. Eur J Appl Physiol 117, 1277–1285 (2017). [DOI] [PMC free article] [PubMed] [Google Scholar]
- 38.Mifflin MD et al. , A new predictive equation for resting energy expenditure in healthy individuals. Am J Clin Nutr 51, 241–247 (1990). [DOI] [PubMed] [Google Scholar]
- 39.Schofield WN, Predicting basal metabolic rate, new standards and review of previous work. Hum Nutr Clin Nutr 39 Suppl 1, 5–41 (1985). [PubMed] [Google Scholar]
- 40.Schoeller DA, van Santen E, Measurement of energy-expenditure in humans by doubly labeled water method. J. Appl. Physiol 53, 955–959 (1982). [DOI] [PubMed] [Google Scholar]
- 41.Fjeld CR, Brown KH, Schoeller DA, Validation of the deuterium oxide method for measuring average daily milk intake in infants. Am J Clin Nutr 48, 671–679 (1988). [DOI] [PubMed] [Google Scholar]
Associated Data
This section collects any data citations, data availability statements, or supplementary materials included in this article.
Supplementary Materials
Data Availability Statement
All data used in these analyses were freely available via the IAEA DLW Database, which can be found at https://doubly-labelled-water-database.iaea.org/home and www.dlwdatabase.org.