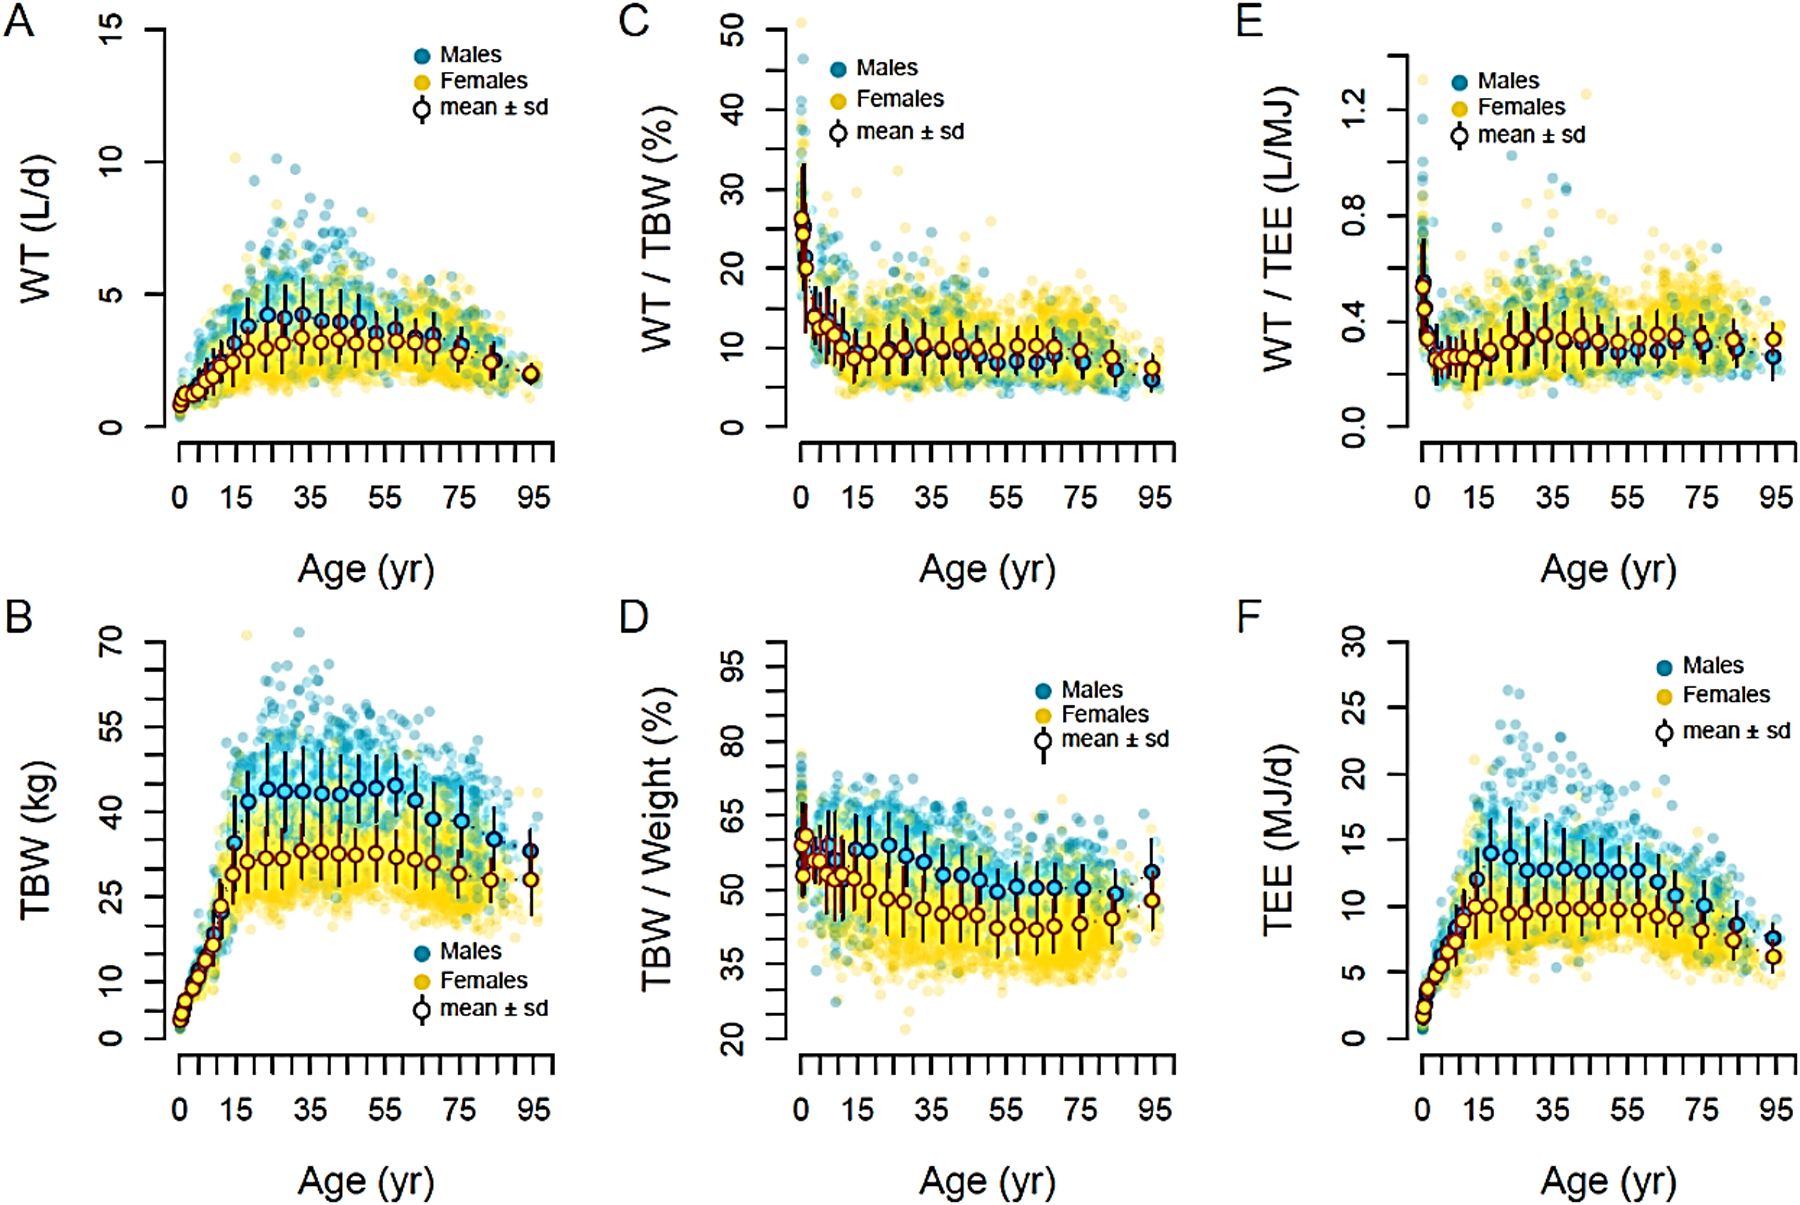
Fig. 2.

Relationships between age and total body water (TBW) or water turnover (WT) in 3729 females (orange) and 1875 males (blue) aged 0 to 96 years with mean and SD. (A) displays WT (L/d), (B) TBW (kg), (C) WT per TBW (%), (D) TBW per body weight (%), (E) WT per total energy expenditure (TEE) (L/MJ), or (F) TEE (MJ/d). Water turnover increases with age until about 30 years and is higher in men (4.3 L/d) than women (3.4 L/d). Water turnover significantly decreases after 30 years in men and 55 years in women, reaching an average water turnover of 3.1 and 2.8 L/d in men and women aged over 70 years, respectively. The average water turnover rate as a percent of total body water is a maximum of ~25% in neonates, decreases with development, and is ~15% in 5-year-old children. At puberty, water turnover falls to ~10% and remains constant until age 40 years in men and 65 years in women, after which it decreases. The average water turnover per TEE is about 0.33 L/MJ (~1.4 ml/kcal) in adults. Note that the variation in water turnover is incredibly large – the low end for men and women is ~1–1.5 L/day while the upper end is around ~6 L/day – and the outliers lie in the 10L/d range. On average, water accounts for 60% of the body weight in infants, 50% in older adults, and only 42% in women at 60 years of age, reflecting a larger % body fat.
