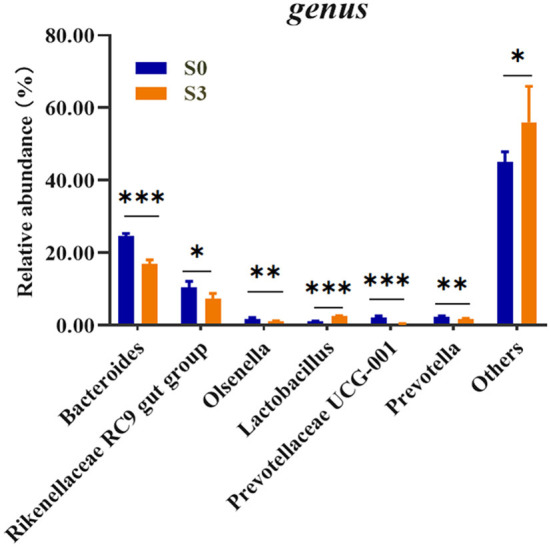
Figure 1.

Comparison of relative abundances of significantly different microbial taxa at the genus levels between S0 and S3. S0, blank control group, broilers were fed diet without BMFA supplementation; S3, broilers were fed diet supplemented with 0.6% of BMFA. The asterisk (*) indicates P < 0.05, (**) indicates P < 0.01, and (***) indicates P < 0.001, n = 5.
