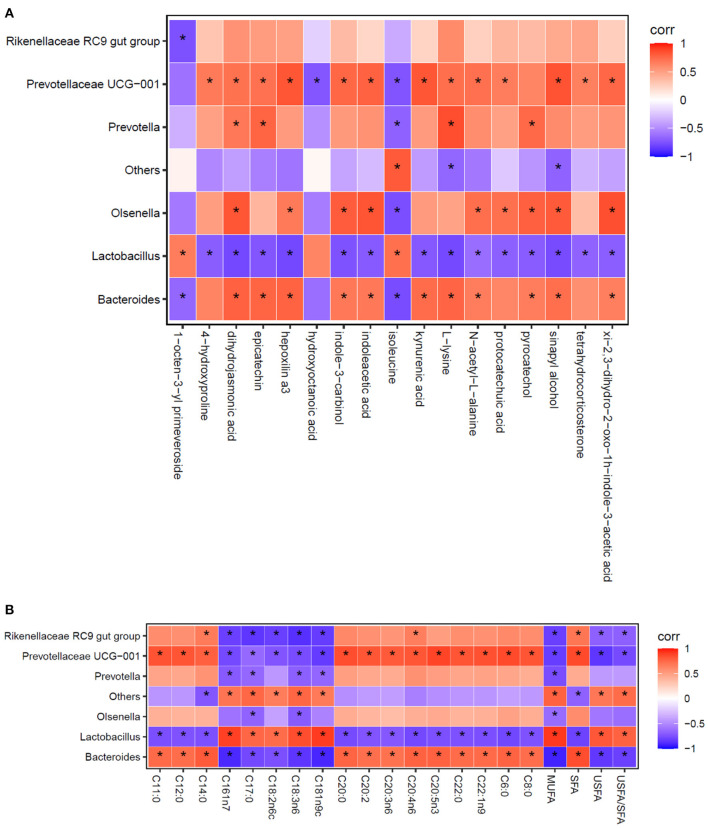
Figure 2.
Spearman correlation analysis between the relative abundance of the most abundant cecal microbes at the genus level and cecal metabolites (A), as well as the composition of fatty acid in breast muscles (B). Each column represents a differential metabolite (A) or fatty acid (B), each row represents a genus, and each square represents a correlation coefficient between the corresponding microbiota component and metabolite or fatty acid. The cross-correlation coefficients were normalized in the range of −1 to 1. Red (1) represent highest values whereas blue (−1) represent the lowest values. The asterisk (*) indicates P < 0.05.

