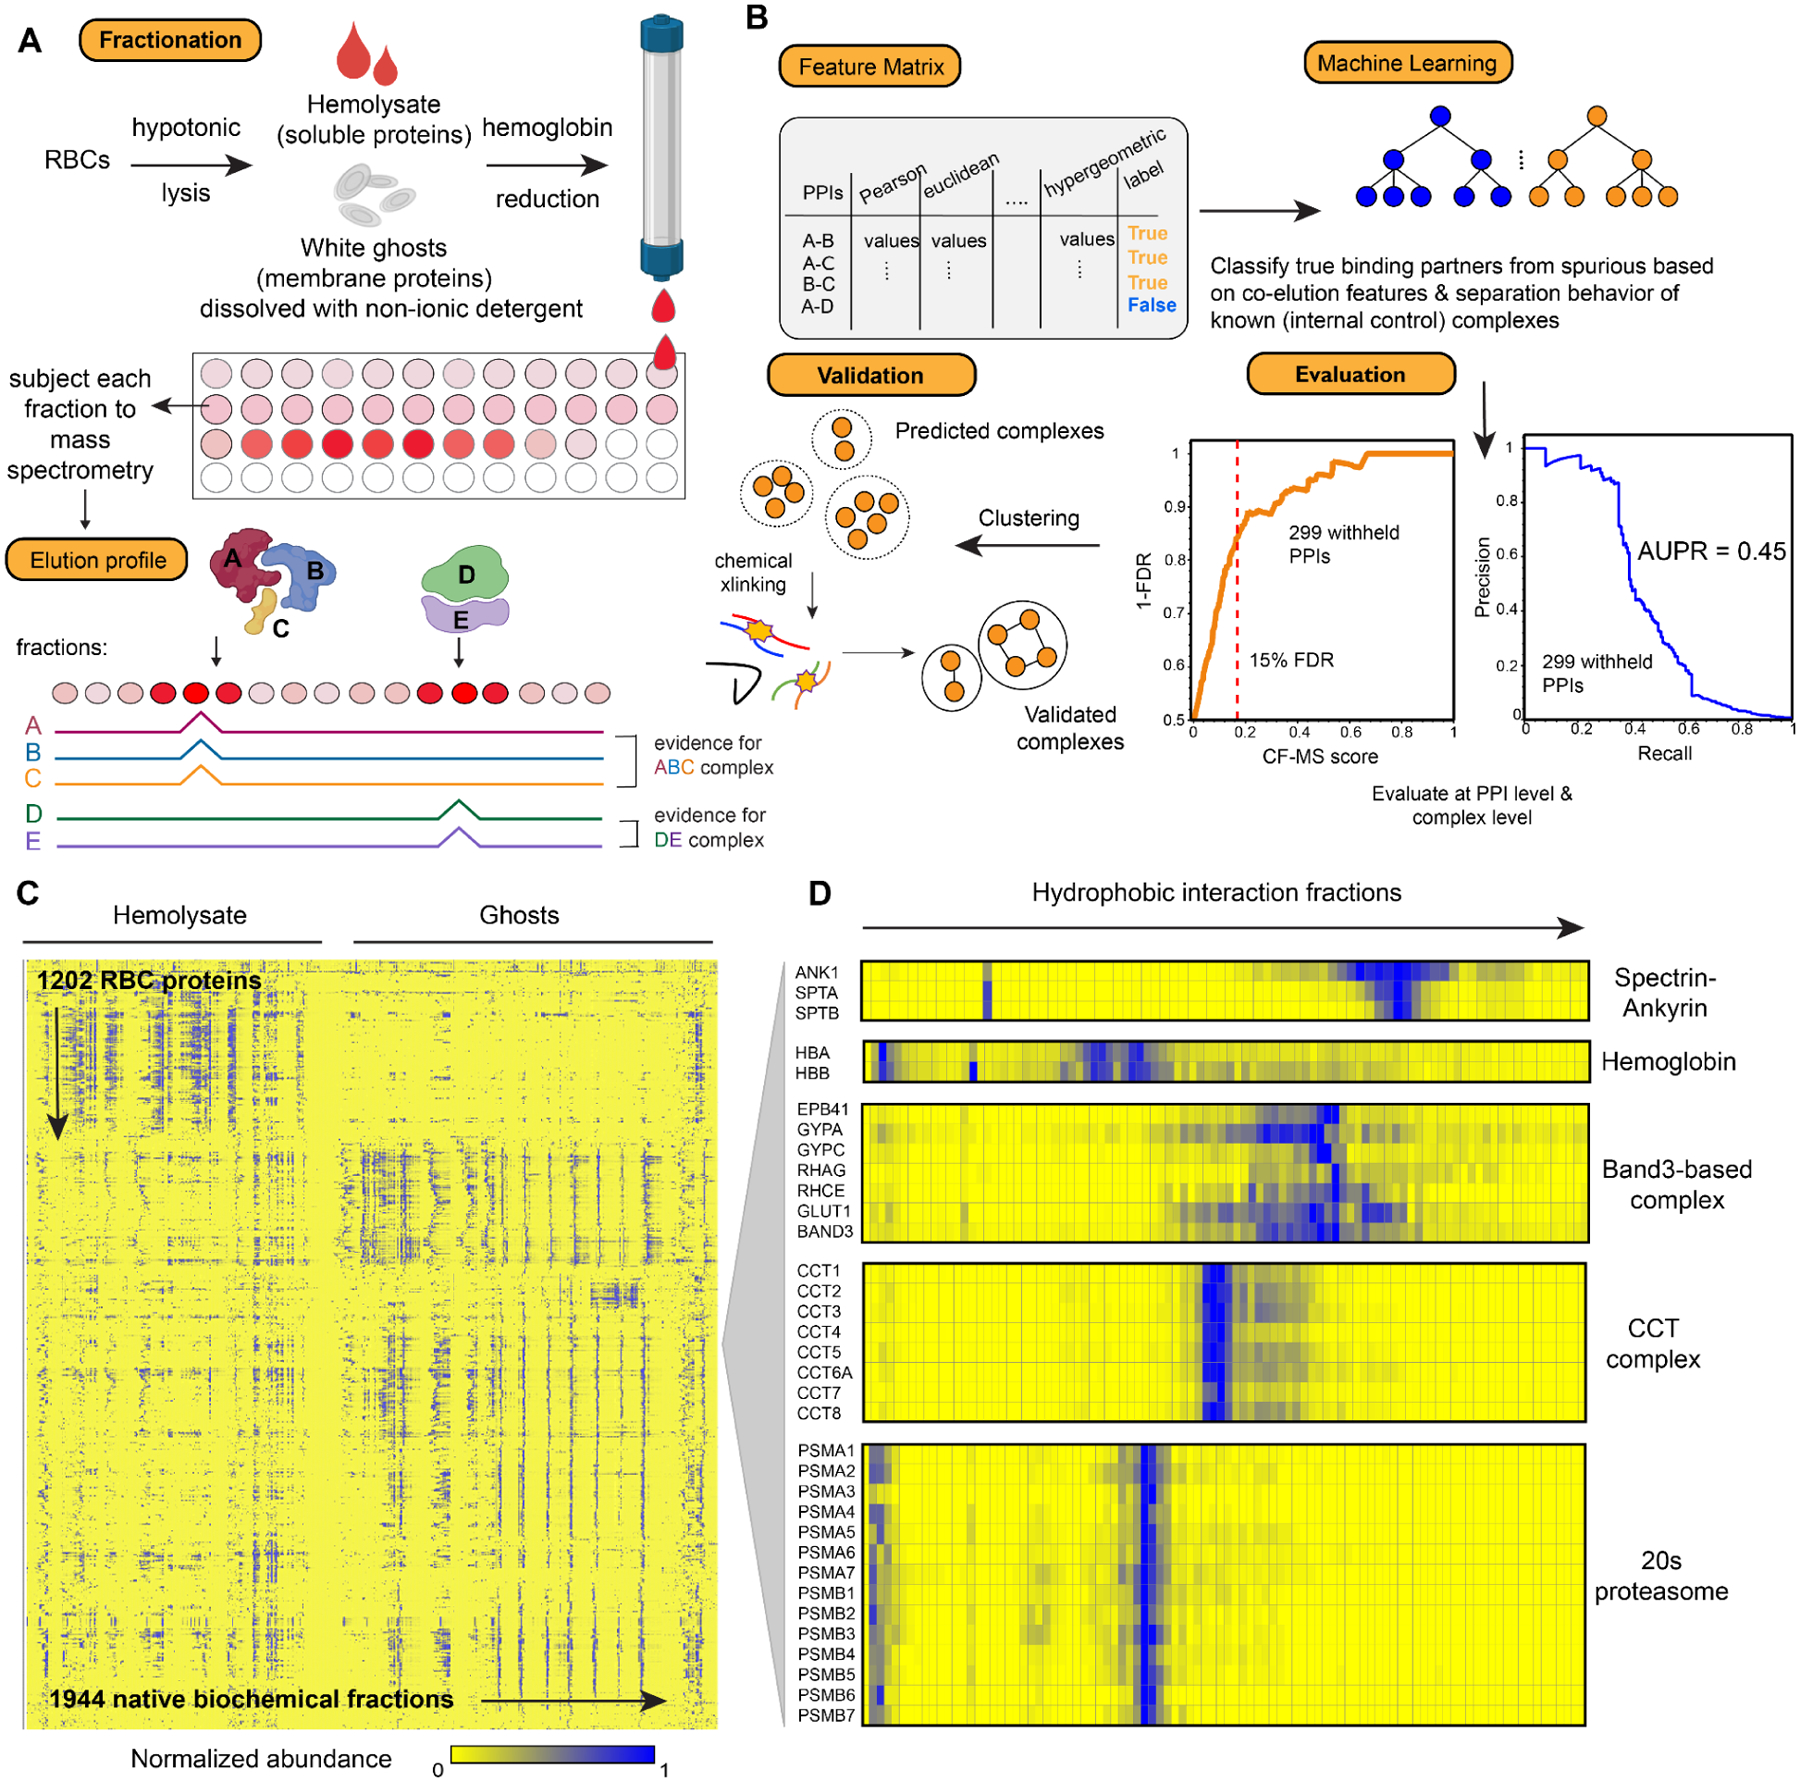
Figure 2. Overview of the integrative Co-Fractionation / Mass Spectrometry (CF-MS) workflow used to determine stable RBC protein complexes.

(A) Hemolysate and white ghosts are chromatographically separated and the proteins in each fraction are identified by mass spectrometry. Elution profiles for each protein are graphically represented as ridgelines across multiple separation experiments. Cell/protein complexes images created with Biorender.com.
(B) Different measures of correlation between each pair of proteins are used to construct a feature matrix for machine learning, which computes a score (CF-MS score) indicating how likely the interaction between two proteins would be in RBCs. The classifier showed good precision and recall (area under the recall-precision curve (AUPR) = 0.45) as assessed on 299 PPIs withheld from the training. Further validations were achieved through crosslinking mass spectrometry and direct visualization by electron microscopy.
(C) Heat map of the full dataset of abundance measurements for each of the 1,202 RBC proteins across all fractionations of hemolysate and white ghosts. Blue indicates non-zero signal.
(D) Enlarged portions of (C) showing examples of strong co-elution observed for subunits (gene names on left) of five well-known protein complexes in RBCs (complex names on right). Color intensity (blue is positive signal) depicts abundances for each protein from a representative hydrophobic interaction chromatography experiment (labeled on top) out of the 30 total separations.
