
Figure 3. Validation of the CF-MS workflow using electron microscopy confirms intact multi-protein complexes.
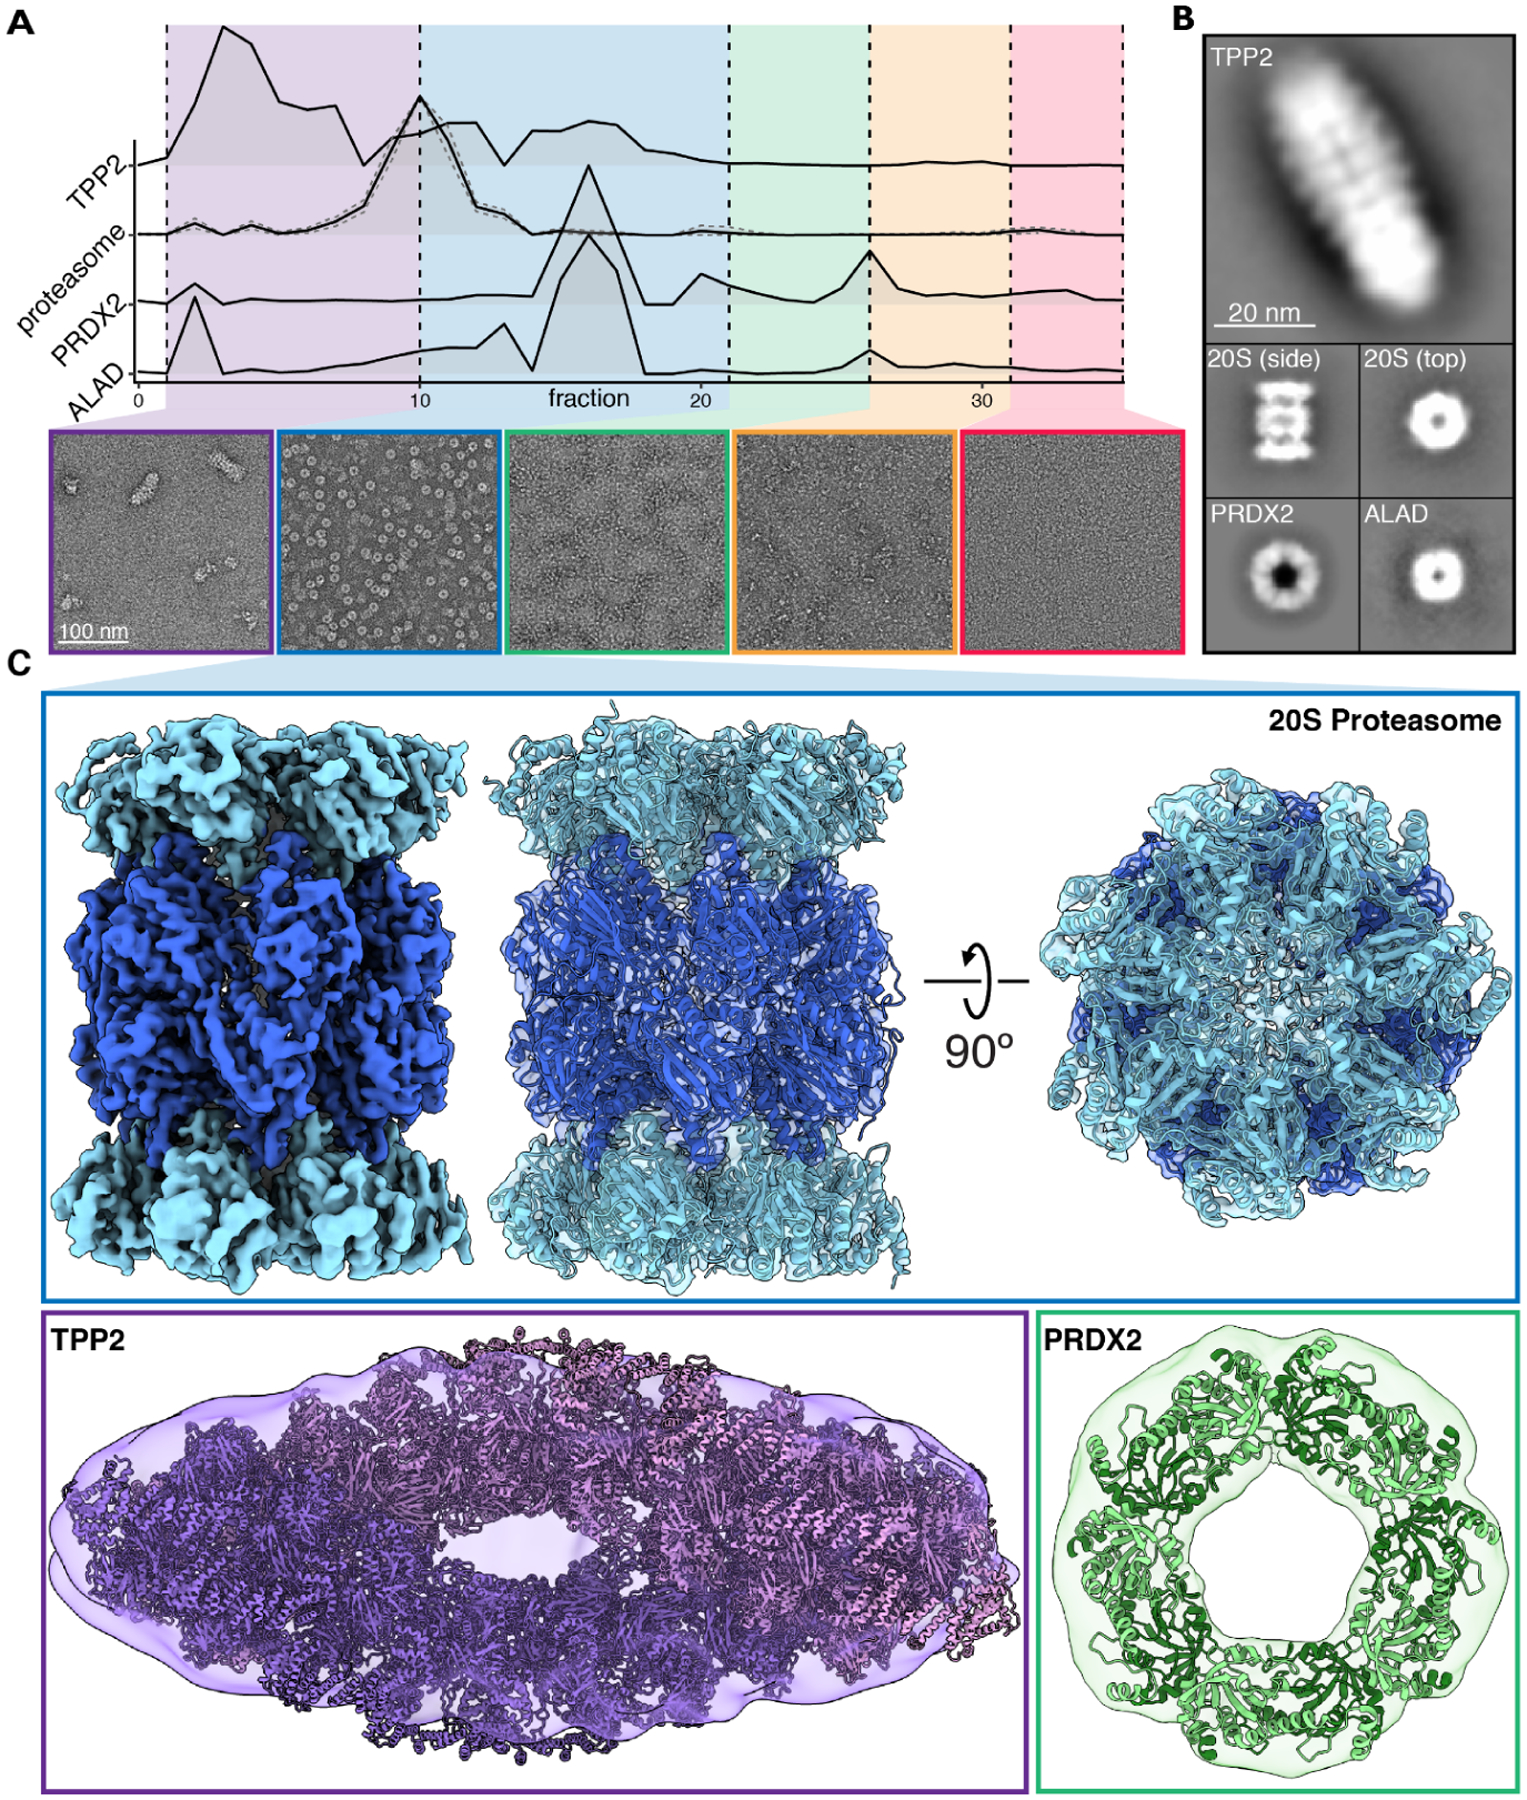
(A) Hemolysate from size exclusion chromatography was partitioned into five groups and visualized with negative stain EM. Elution profiles from corresponding mass spectrometry data were used to assist in identifying abundant protein assemblies.
(B) Reference-free 2D class averages of four protein complexes spanning ~220 – 5,000 kDa were identified in hemolysate.
(C) Cryo-EM reconstruction of the 20S proteasome. Negative stain structures of TPP2 and PRDX2 along with docking of their corresponding atomic structures PDB 3LXU (Chuang et al., 2010) and PDB 1QMV (Schröder et al., 2000), respectively.