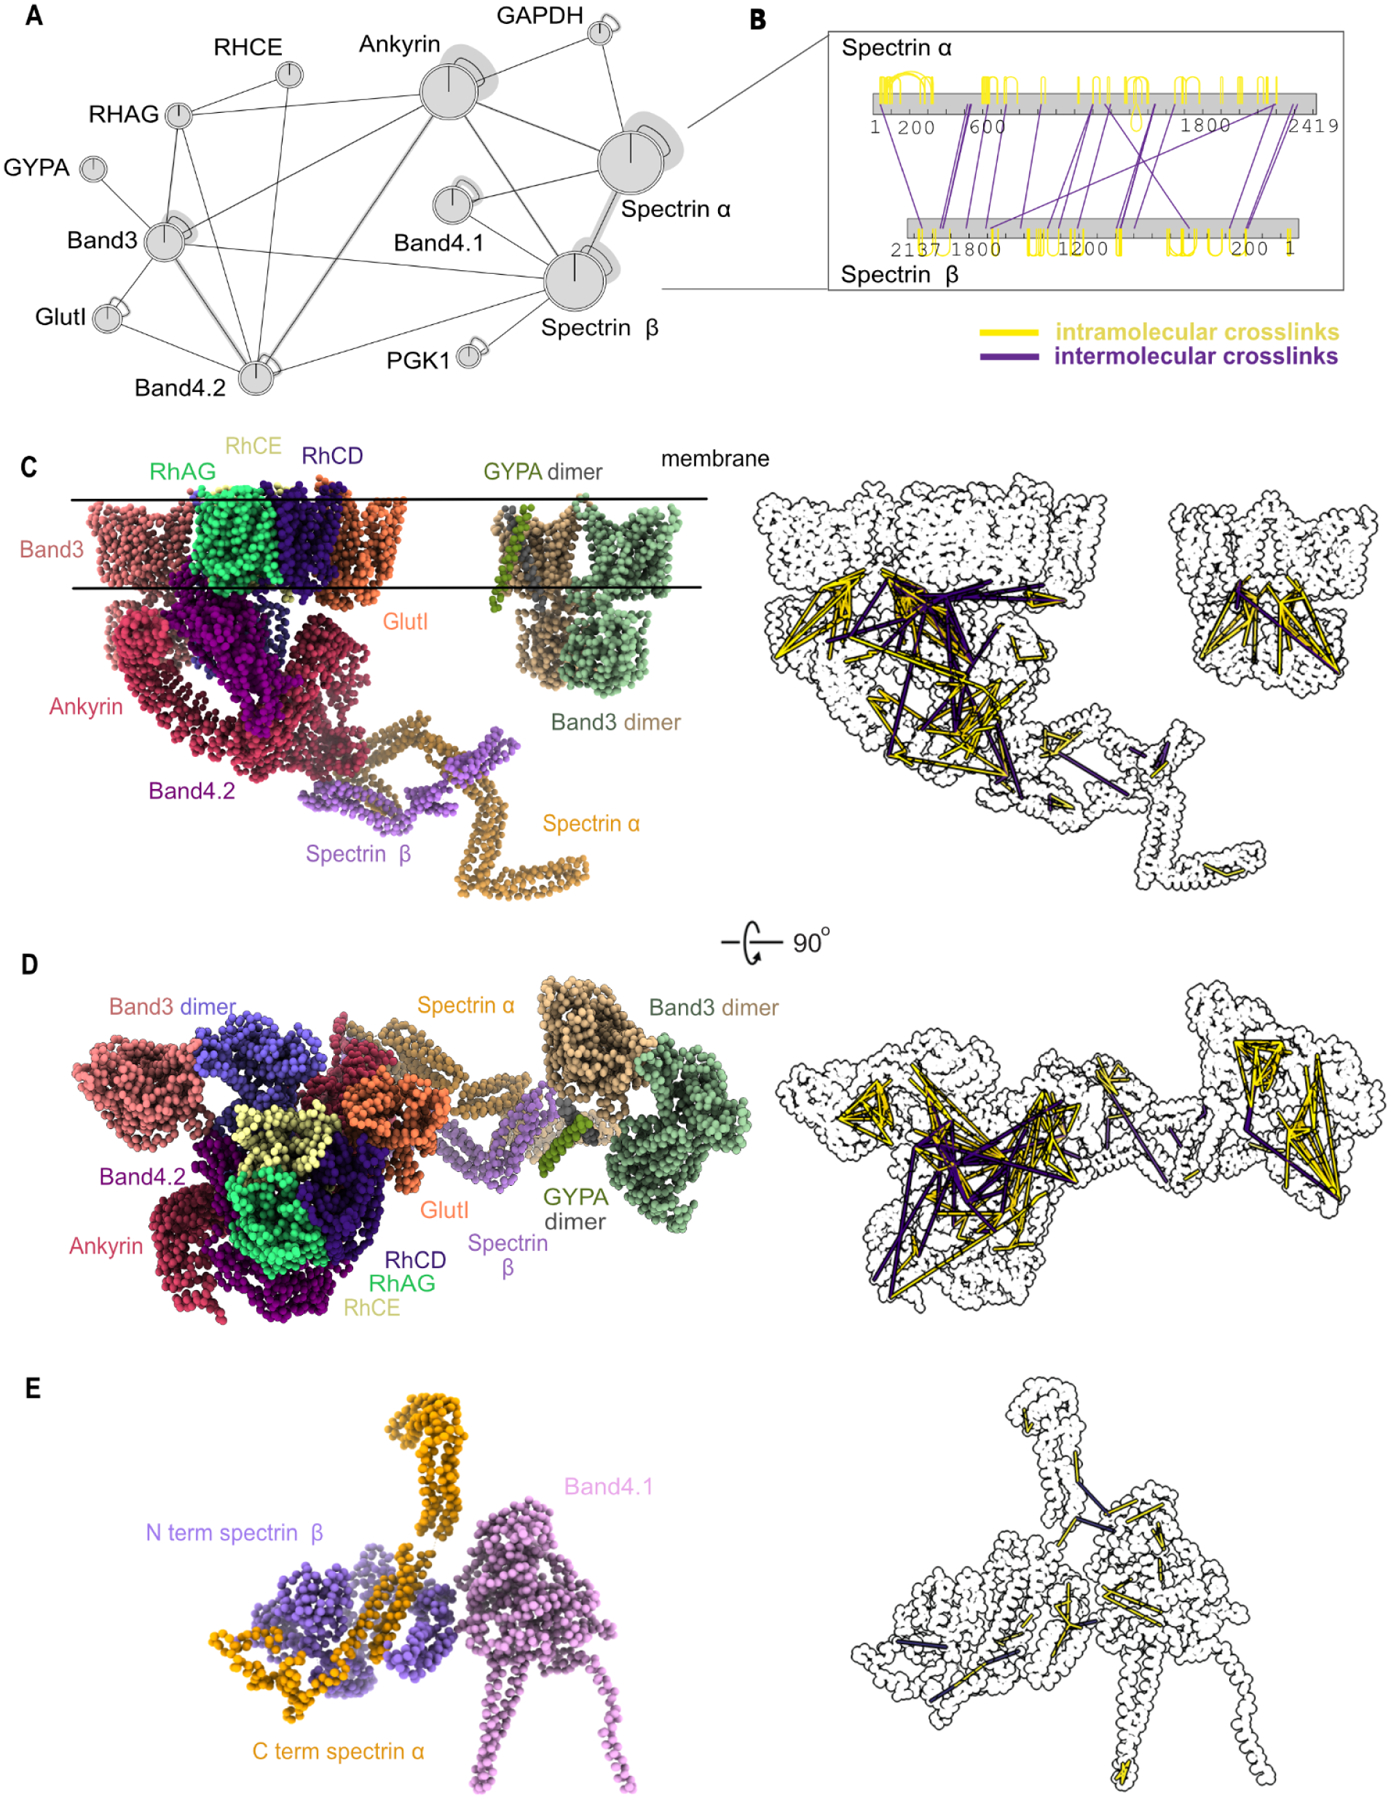
Figure 5. Chemical crosslinks confirm mapped interactions and constrain 3D modeling of membrane/cytoskeletal complexes.

(A) Network plot represents crosslinked interactions among proteins (shown as gene names) in RBC cytoskeletal complexes. Line between each node indicates detected crosslink(s). Shaded lines indicate dense crosslinking.
(B) Bar plot shows extensive crosslinks between spectrin alpha and beta supporting a head-to-tail conformation. Numbers under each bar indicate the amino acid position on each protein. Yellow line indicates intramolecular crosslinks and purple line indicates intermolecular crosslinks.
(C)Side view of integrative structure of band 3-Ank1 complex and band 3-GYPA complex. Our model suggests that GlutI competes with the Rh proteins for binding with band 3 and band 4.2. The outline figure on the right shows intramolecular and intermolecular crosslinks that are overlaid onto the structure.
(D)Top view of integrative structure of the band 3-Ank1 complex and band 3-GYPA complex.
(E) Integrative structure of band 4.1-spectrin complex. Six of these complexes are proposed to link spectrin heterodimers with actin (Lux, 2016).
