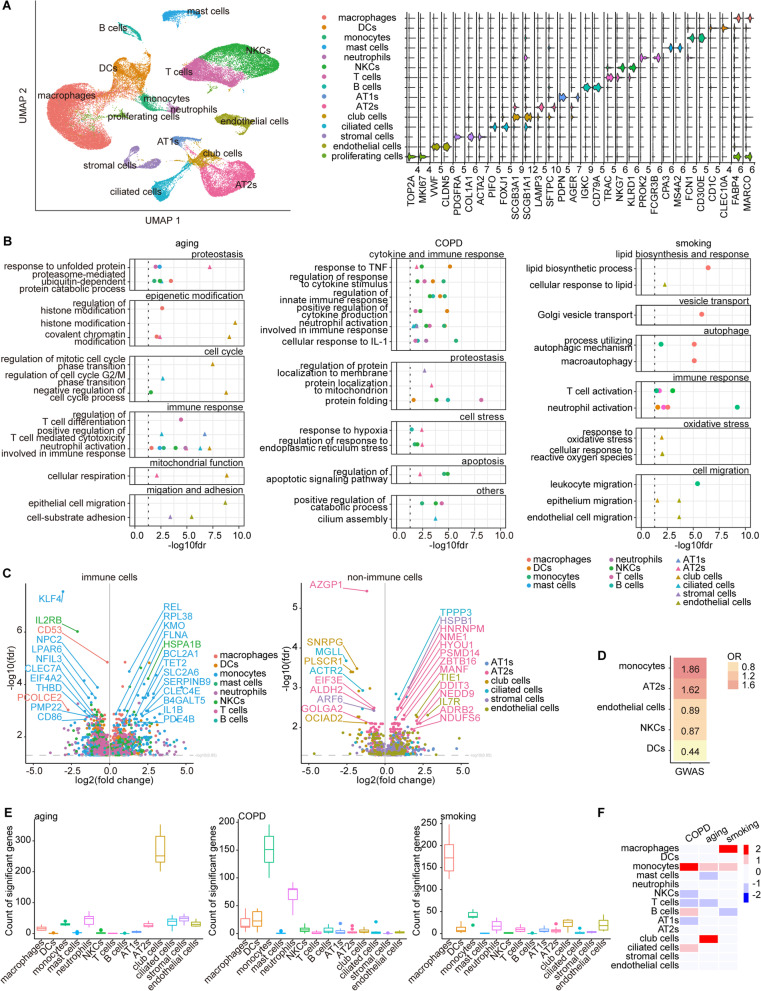
Fig. 2.
Cell-type-specific gene expression changes under different conditions. A UMAP plot of the 15 identified cell types is used to visualize the result of clustering of the 66,610 cells from all 9 lung tissue samples (left). Violin plots showing the expression of marker genes of each cell type (right). B Functional enrichment analysis showing biological processes in GO categories of cell-type specific DEGs associated with aging (left), COPD (middle), and smoking (left). Different colors represent different cell types, among which immune cells are displayed as triangles and non-immune cells as circles. C Volcano plots for COPD-associated DEGs expressed in immune cells (left) and non-immune cells (right). One dot represents a DEG. Different colors represent different cell types. D Heatmap showing the fisher’s exact test enrichment odds ratio of COPD GWAS risk genes in COPD-associated DEGs of each cell type. Only cell types with fisher’s exact test p-value < 0.05 are displayed. E Box plots showing the number of aging- (left), COPD- (middle), and smoking-associated DEGs (right) for all cell types normalized by the number of cells in downsampling analysis. F All the cell types except proliferating cells are prioritized according to the separability of perturbed and unperturbed cells within a high-dimensional space under the conditions of aging, COPD, and smoking in AUGUR analysis, respectively, which is visualized as heatmap. The color of the heatmap indicates high (red) or low (blue) cell type prioritization score

