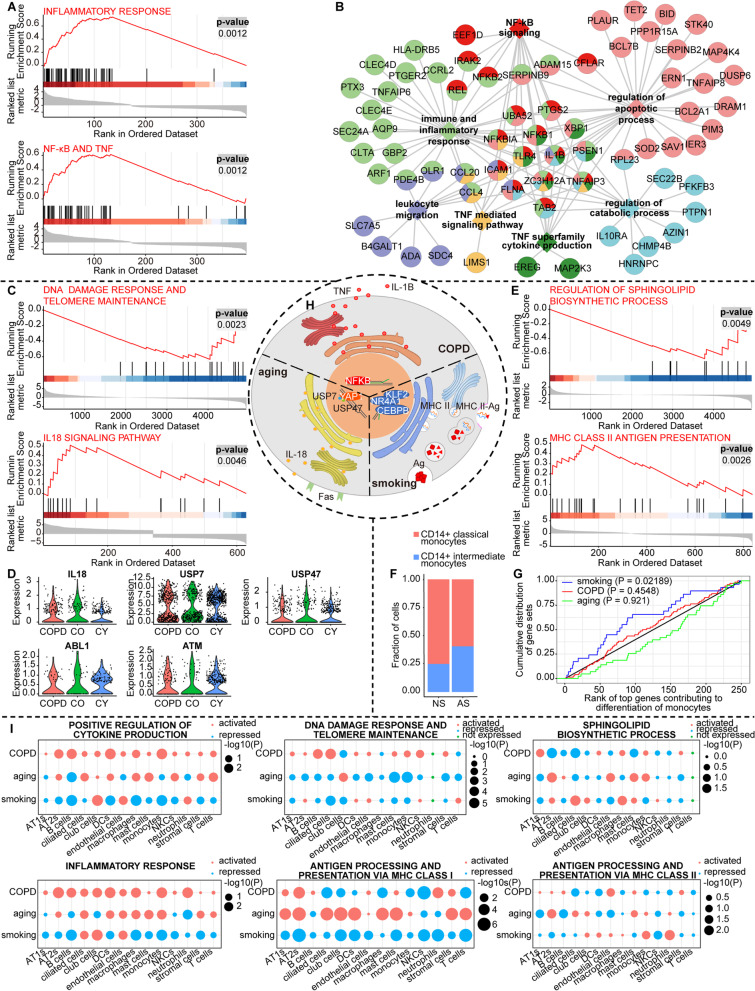
Fig. 3.
Condition-specific status of monocytes presents snapshots of system-level malfunctions. A GSEA analysis highlighting the inflammatory response and NF-κB as well as TNF signalings activated in monocytes under COPD. B Functional enrichment network generated from the up-regulated COPD-associated DEGs in monocytes. Genes (circles) are linked with the corresponding biological processes (squares in the same color) in which they are enriched. C GSEA analysis highlighting DNA damage response and telomere dysfunction as well as activated IL-18 signaling pathway in aged monocytes. D Violin plots displaying the expression distributions of IL-18, USP7, USP47, ABL1, and ATM in monocytes from lungs of young controls (CY), old controls (CO), and COPD patients (COPD). E GSEA analysis highlighting inhibited inflammatory response and activated antigen presentation via MHC class II in monocytes induced by smoking. F Bar plot showing the relative proportion of CD14+ classical monocytes and CD14+ intermediate monocytes across active smoker (AS) and never-smoker (NS) groups. G Kolmogorov–Smirnov plot showing the enrichment of COPD-, aging-, and smoking-associated DEGs of monocytes among the set of top 250 driver genes (largest waldStat from slingshot associationTest) responsible for monocytes differentiation from the CD14+ classical monocytes to the CD14+ intermediate monocytes. The one-sided (greater) Kolmogorov–Smirnov (K-S) test is used to determine the enrichment p-value. H Schematic diagram demonstrating specific changes of monocytes under COPD, aging, and smoking conditions. Monocytes from COPD lung tissues show aberrantly activated NF-κB signalling, along with increased expression of pro-inflammatory factors, such as IL-1β and TNF (COPD). In aged monocytes, IL-18 is significantly up-regulated due to DNA damage and telomere dysfunction, providing linkage between innate and adaptive immunity (aging). Monocytes are blocked in CD14+ intermediate sub-cluster by smoking via down-regulating differentiation driver genes, with enhanced function of antigen processing and presentation via MHC class II (smoking). I Dot plots showing the extent to which the biological processes of our interest are activated or repressed in all the cell types under COPD, aging, and smoking conditions by GSEA analysis. The red dot represents activation (normalized enrichment score > 0), the blue one represents repression (normalized enrichment score < 0), and the green one represents that genes involved in the biological process are not expressed in this cell type; p-value (P) is indicated by dot size

