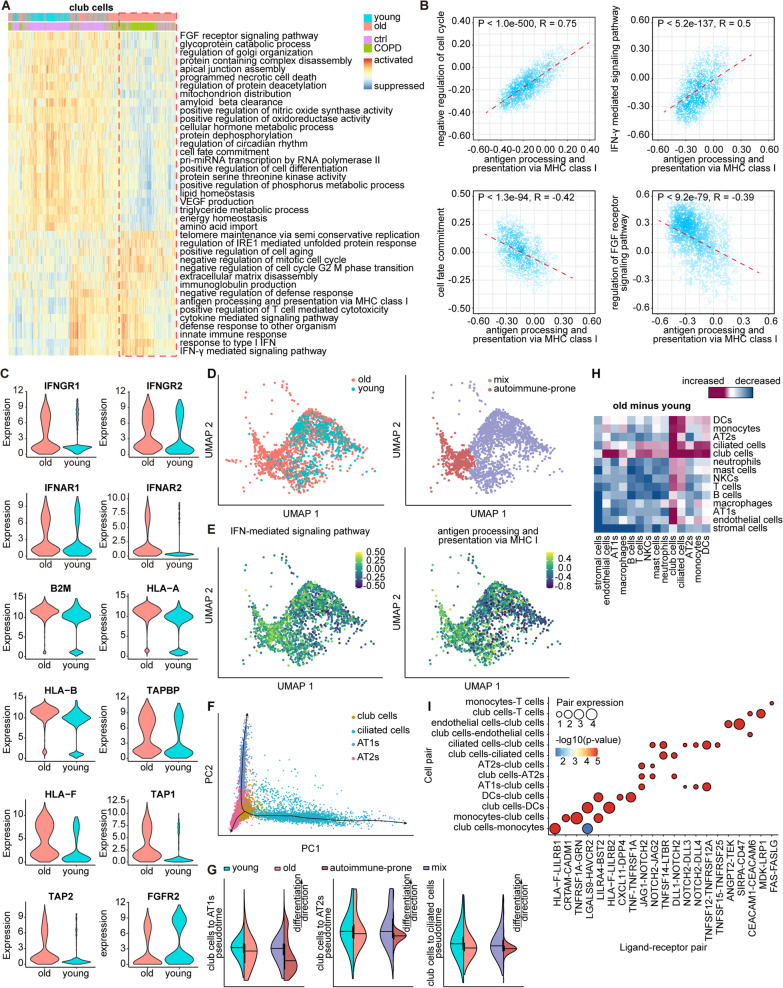
Fig. 5.
Potential mechanism of aging facilitating COPD development: An autoimmune airway niche modulated by aged club cells underlying the injury of airway epithelia. A Heatmap showing GSVA analysis enrichment scores of the top altered biological pathways in club cells from lung tissues of young (cyan) and old (pink) individuals. The colors from red to blue represent alterations of biological pathways states from activated to suppressed. The disease conditions of individuals from which club cells were derived are reflected as different colors of the bar above the heatmap. A distinct subset of club cells characterized by hallmarks of aging are framed by a red dotted rectangular box in the heatmap, which are mainly derived from COPD lungs. B Scatterplots showing the correlations of GSVA analysis enrichment score between pathway of antigen processing and presentation via MHC class I and four other biological pathways (including negative regulation of cell cycle, IFN-γ-mediated signaling pathway, cell fate commitment, and regulation of FGF receptor signaling pathway) in club cells. P: Pearson correlation p-value of two-sided paired t-tests. R: Pearson correlation coefficient of two-sided paired t-tests. C Violin plots for genes encoding IFN receptors (IFNRG1, IFNRG2, IFNRA1, and IFNRA2), genes involved in pathway of antigen processing and presentation via MHC class I (B2M, HLA-A, HLA-B, HLA-F, TAP1, TAP2, and TAPBP), and FGFR2 (FGF receptor 2) in club cells from lung tissues of young (cyan) and old (pink) individuals. D UMAP plot showing all the club cells from lung tissues of young (cyan) and old (pink) individuals (left). All the club cells are classified in depth into several sub-clusters, among which one sub-cluster highly aggregated in the club cells from lung tissues of old individuals is named as autoimmune-prone sub-cluster (brown). Others are together referred to as mix sub-cluster (purple). UMAP plot showing the two sub-clusters of all the club cells (right). One dot represents a club cell. E Feature plots for GSVA analysis enrichment scores of IFN-γ-mediated signaling pathway (left) and antigen processing and presentation via MHC class I (right) in all the club cells. One dot represents a club cell. The colors from yellow to dark green represent alterations of biological pathways states from activated to suppressed. F A predicted trajectory of airway epithelial cells differentiation including club cells (yellow), ciliated cells (green), AT1s (purple), and AT2s (red). Each point corresponds to a single cell. G Violin plot of club cells from lung tissues of young and old individuals as well as autoimmune-prone sub-cluster of club cells and mix sub-cluster of club cells on differentiation of club cells to AT1s (left), club cells to AT2s (middle), and club cells to ciliated cells (right) pseudotime. H Heatmap representing the changes of CCIs among 15 cell types predicted by CellPhoneDB between young and old lungs. The colors from red to blue represent changes of CCIs from increased to decreased. I Overview of selected ligand-receptor pairs (x-axis) predicted to be responsible for the enhanced interactions between the given cell pairs (y-axis) in aged lungs, compared to young lungs. Each circle represents an interacting ligand-receptor pair. The p-values of CellPhoneDB CCIs are indicated by colors of circles. The means of the average expression levels of interacting ligand in sender cells and interacting receptor in receiver cells are indicated by circle size

