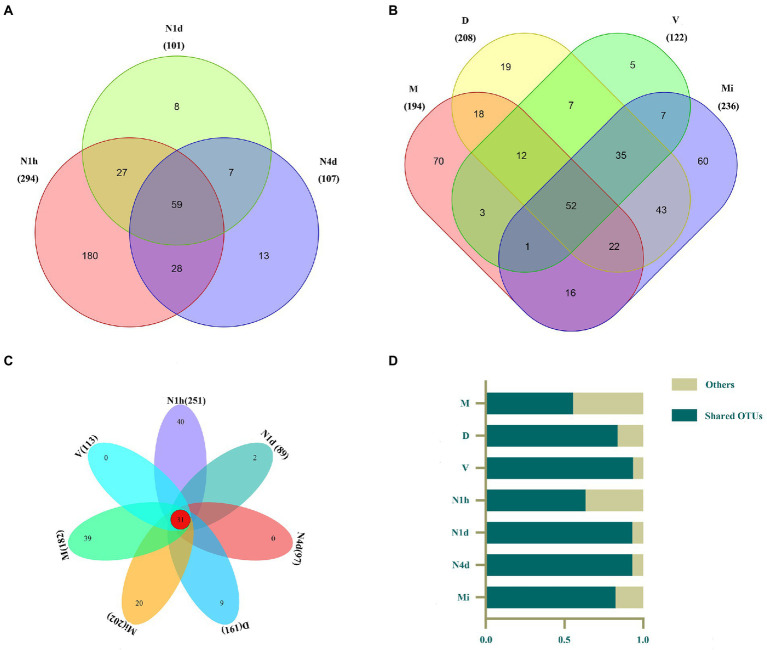
Figure 2.
Venn diagram of the microbiomes across multiple sites in the neonates and their mothers. (A–C) The Venn diagram illustrated the number of OTUs in each group and showed the shared OTUs among the neonatal groups (A), maternal groups (B), and all seven groups (C). (D) The contributions of these 31 shared OTUs to the microbiomes in all groups were shown in the histogram.

