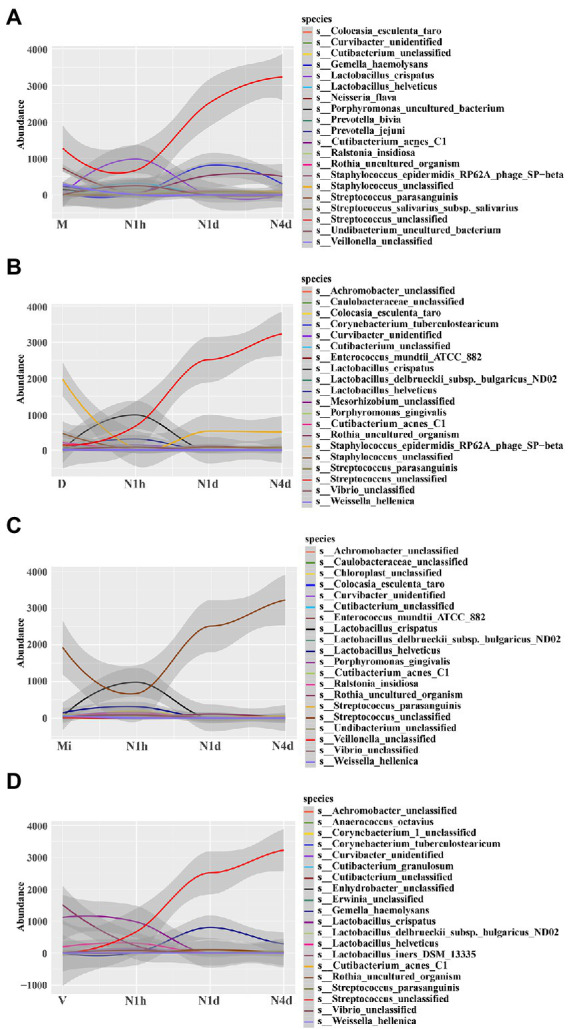
Figure 5.

STAMP analysis of microbiomes to investigate different bacteria among groups. (A–D) STAMP analysis of neonatal groups in comparison with the M group (A), D group (B), Mi group (C), and V group (D), and then all the significant bacteria in each comparison were fit linearly. The y-coordinate represented the relative abundance of the species, and the x-coordinate represented the name of sample groups. The relative abundances of the top 20 taxa at the species level of each group were shown.
