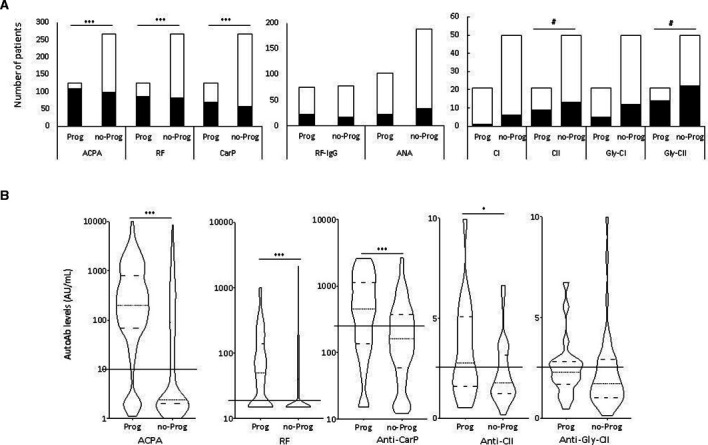
Figure 1.

Positivity (A), as number of patients and (B) levels of AutoAb in at-risk individuals. (A) Bars represent the number of individual tested positive (black) or negative (white) for each individual. X2 tests were used individually to assess associations with progression (***p<0.0001, #p<0.100). ACPA n=363, RF n=381, anti-CarP n=372, RF-IgG n=152, ANA n=290, all anti-collagen autoAbs n=71. (B) Violin plots represent the distribution of AutoAb levels observed. Solid lines across the plot indicate the positivity cut-off for each test. Medians and quartiles of distribution are indicated by dotted and dashed lines within violin plot respectively. MWU tests comparing levels were used individually to assess associations with progression (*p<0.05, ***p<0.001, #p<0.100). ACPA, anticitrullinated protein antibody; ANA, anti-nuclear Ab; RF, rheumatoid factor.
