Fig. 5.
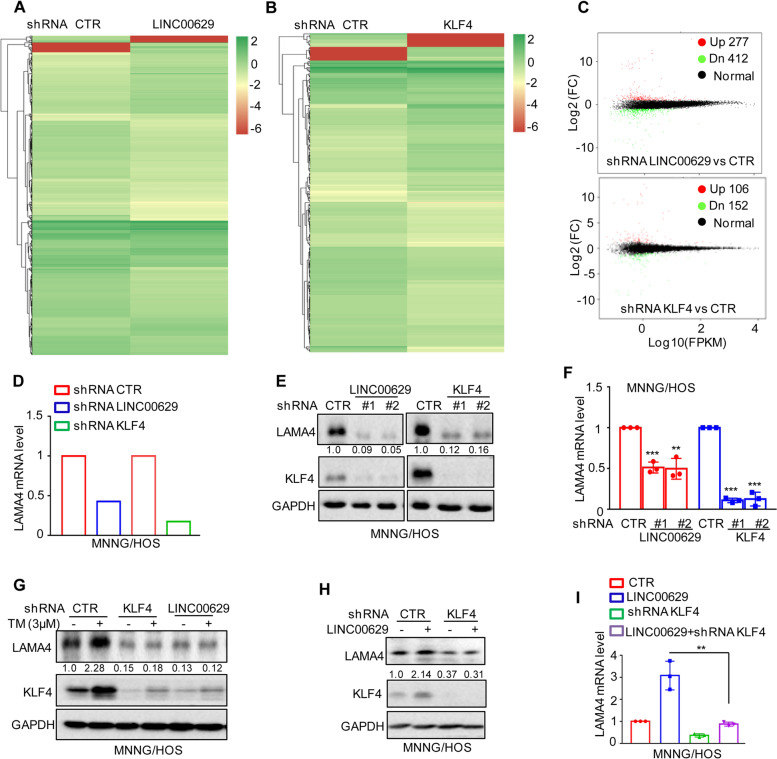
KLF4 upregulates LAMA4 expression. A-B Heatmap showing the altered genes identified by RNA sequencing analysis in LINC00629 (A)- or KLF4 (B)-depleted MNNG/HOS cells. C Volcano plots showing differentially expressed mRNAs for LINC00629 knockdown or KLF4 knockdown versus the controls (absolute log2-fold change > 1 and q value < 0.05). The green dot indicates the downregulated genes, and the red dot indicates the upregulated genes. D The mRNA levels of LAMA4 are shown from RNA sequencing data. E-F The protein and mRNA levels of LAMA4 were detected by Western blot (E) and qRT–PCR (F) in MNNG/HOS cells with or without LINC00629 or KLF4 knockdown. Numbers represent the relative intensities of western blot bands of LAMA4 to GAPDH. G MNNG/HOS cells with or without KLF4 or LINC00629 knockdown were treated with 3 μM TM for 36 h. The expression of LAMA4 was detected by Western blot. Numbers represent the relative intensities of western blot bands of LAMA4 to GAPDH. H-I LINC00629 was overexpressed in MNNG/HOS cells with or without KLF4 knockdown. The protein and mRNA levels of LAMA4 were detected by Western blotting (H) and qRT–PCR (I). Numbers represent the relative intensities of western blot bands of LAMA4 to GAPDH. Data in F and M were analysed by Student’s t test, *p < 0.05, **p < 0.01, ***p < 0.001

