. 2022 Dec 16;19(4):e20220097. doi: 10.1590/1984-3143-AR2022-0097

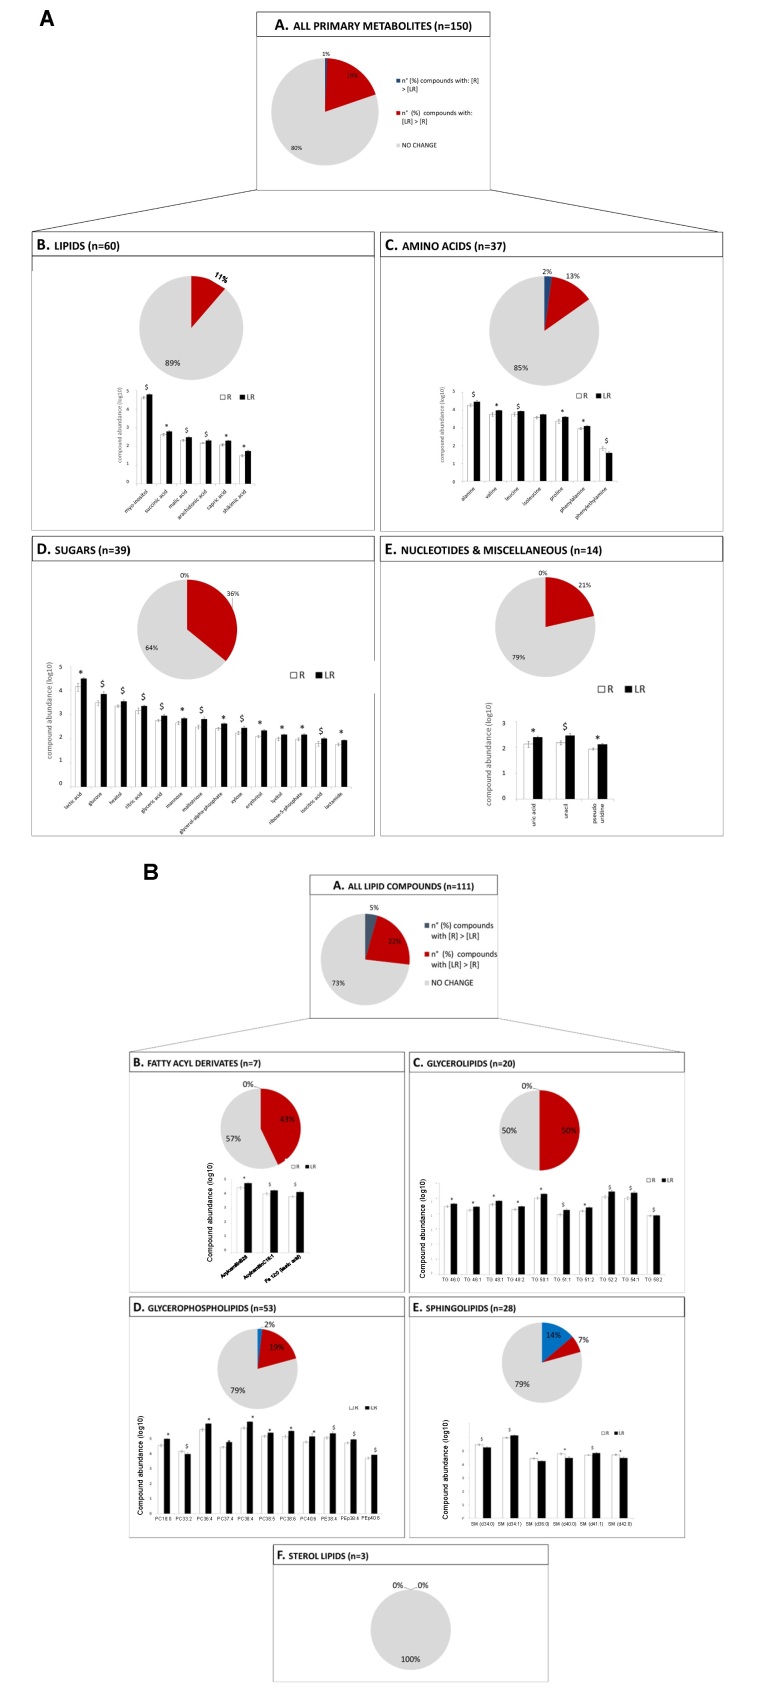
Figure 4. Abundance of primary metabolite (A) and lipids (B) in luminal flushings collected post-mortem, at day four of the estrous cycle, from cows treated to ovulate a larger follicle (“receptive” luminal environment; R) or a smaller follicle (“low-receptivity” luminal environment; LR). For both A and B: Panel A. Total number of primary metabolites/lipids that displayed receptivity-related abundance (P<0.1) in the D4 uterine flushing. Panel B, C, D & E. Assignment of receptivity-associated compounds (P<0.1) to main biochemical metabolite and lipid classes. For pie-charts: (grey; ■) % for compounds with no receptivity-linked differences in concentrations; (blue; ■) % of compounds with greater abundance in R uterine flushing vs. LR uterine flushing; (red; ■) % of compounds with greater abundance in LR uterine flushing vs. R uterine flushing. For bar-charts: (R; □) receptive cows and (LR; ■) low receptive cows; bar represents mean ± standard error of the mean; Metabolite and lipid data were log10 transformed before plotting. Group means of compounds with * superscript are significantly different (P<0.05); Group means of compounds with $ superscript approached significance (P<0.1).

Figure 4