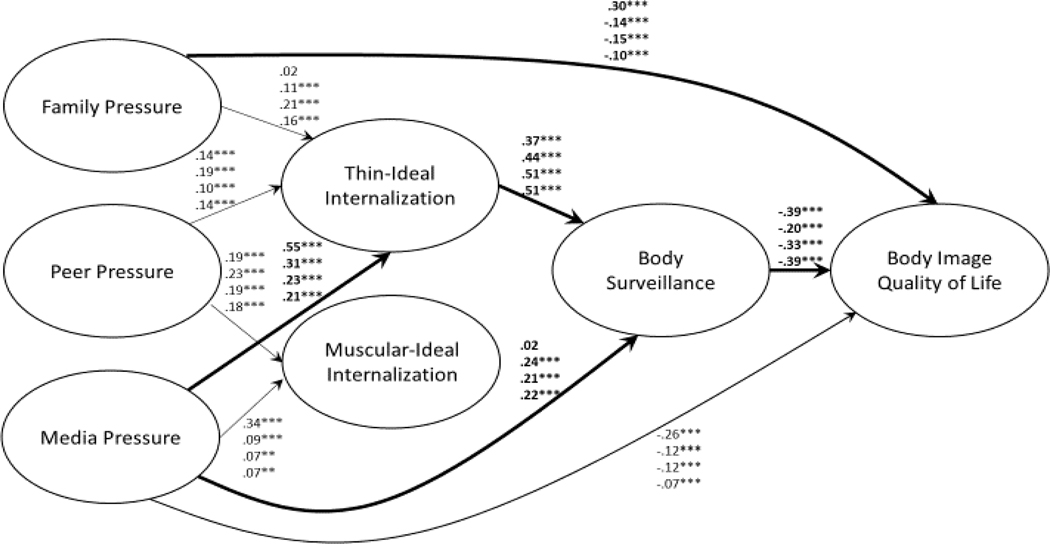
Figure 4.
Model Examining Body Image Quality of Life Based on BMI Grouping
Note. Multiple groups analysis (based on BMI grouping) of the structural model with body image quality of life. Standardized betas are presented as the path coefficients, with the top coefficient representing the lowest BMI group, the second to top coefficient representing the low BMI group, the second to bottom coefficient representing the medium BMI group, and the bottom coefficient representing the high BMI group. Paths that differed in strength between the groups are bolded. ***p < .001, **p < .01, *p < .05.

