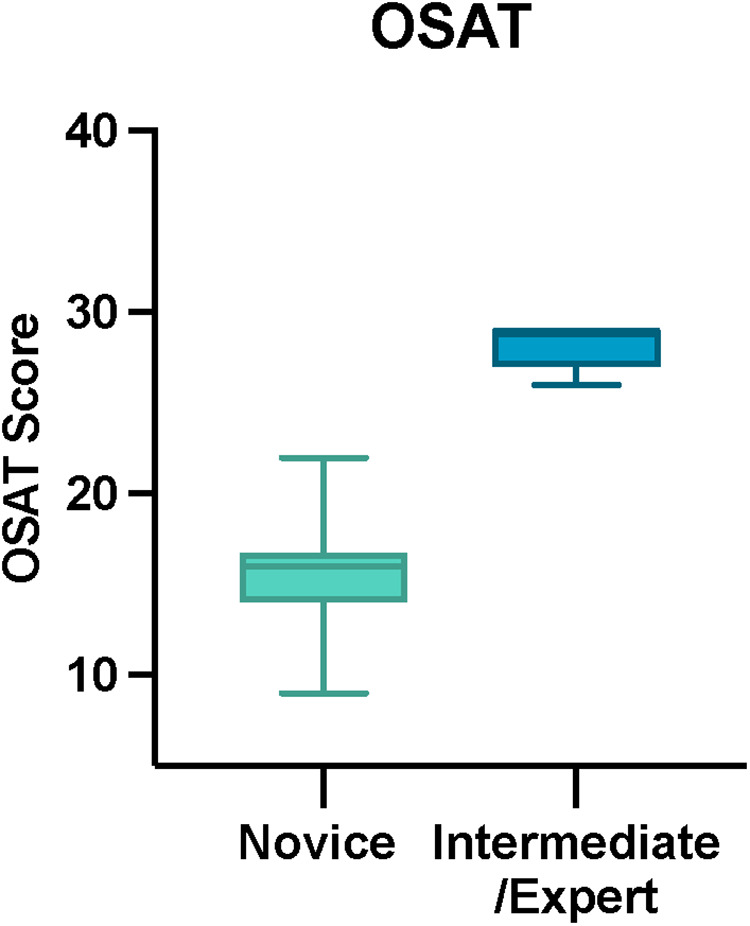
Figure 5.

Total OSAT score for novice and intermediate and expert participants. The horizontal solid line in the middle of the box is the median value of the scores and the lower and upper boundaries indicate the 25th and 75th percentiles, respectively. The largest and smallest observed values are shown; lines (whiskers) are drawn from the ends of the box to those values.
