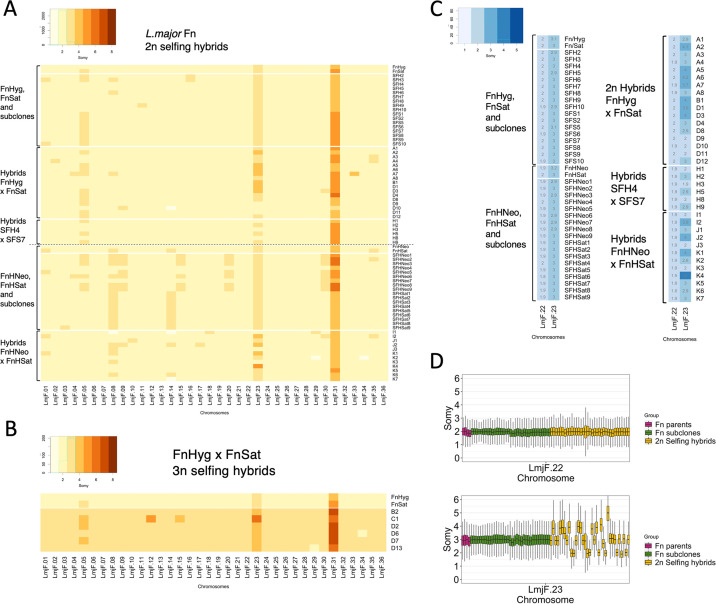
FIG 4.
Chromosome copy number variations generated by self-hybridization versus clonal growth. (A) Heatmap indicating copy number of all 36 chromosomes, rounded off to the nearest integer value, in the parental clones and 2n hybrids and subclones derived from each parent. (B) Heatmap of integer somies in the parental clones and 3n hybrids. (C) Heatmap of integer somies in the parental clones and all 2n hybrids and subclones for chromosomes 22 and 23. Overlaid are the somy values rounded to the nearest 0.1. (D) Boxplots of the somy scores for chromosomes 22 and 23 in Fn parental lines (magenta), 2n selfing hybrids (yellow), and Fn parental subclones (green) from all crosses pooled. The frequencies of selfing hybrids showing a mean chromosome 23 somy value of 2, 3, or 4 were 28.6%, 42.8%, and 25.8%, respectively. No significant difference between observed and expected frequencies: Chi square value, 0.8227; degrees of freedom, 2; P = 0.6628. GIP and giptools were used to calculate somy score distributions with genomic sequence coverage bins of 300 bp (gip.readthedocs.io/en/latest/giptools/karyotype.html). Somy score distributions for all chromosomes in 2n samples analyzed can be found in Fig. S8 and S9 for FnHyg × FnSat and FnHNeo × FnHSat crosses, respectively.

