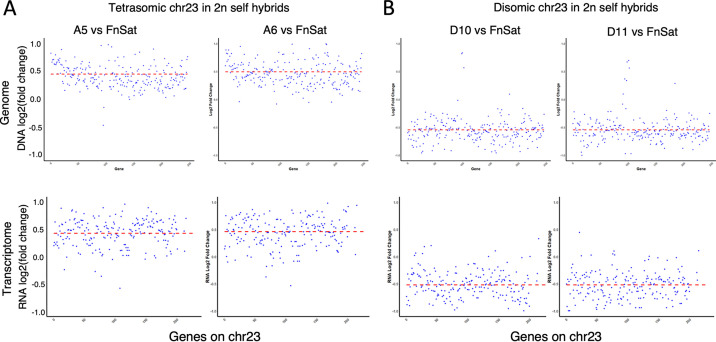
FIG 5.
Gene dosage effect due to chromosome copy numbers in chromosome 23 (chr23). The x axis represents the base pair position along chromosome 23. The y axis represents the DNA (upper panel) and RNA (lower panel) read counts in hybrids A5 and A6 (tetrasomic chr 23) relative to the FnSat parent (A), and in hybrids D10 and D11 (disomic chr23) relative to the FnSat parent (B).

