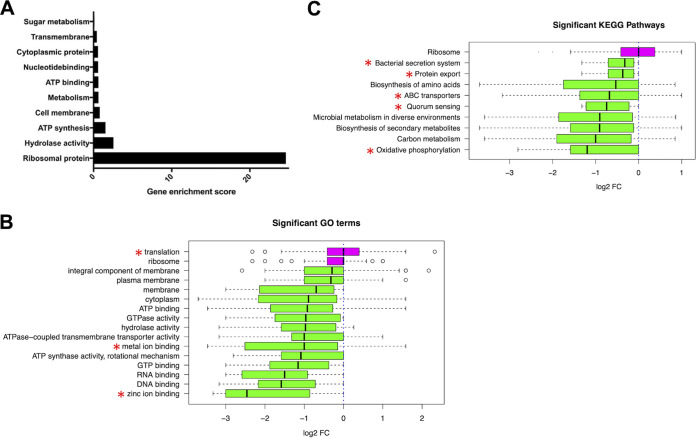
FIG 2.
Case Study 1 - Enterococcus faecium proteomic data. (A) Results of a gene ontology enrichment analysis for proteomic data from extracellular vesicles secreted by Enterococcus faecium strain DO during the exponential versus stationary growth phase performed by Wagner et al. (17). This figure was originally published by Wagner et al. (17) as Fig. 6A and is licensed under CC BY-NC-ND 4.0. (B) Significantly activated (magenta) or repressed (green) GO terms identified by ESKAPE Act PLUS. Red asterisks highlight GO terms that were not mentioned in the original publication. (C) Significantly activated (magenta) or repressed (green) KEGG pathways identified by ESKAPE Act PLUS. Red asterisks highlight KEGG pathways that were not mentioned in the original publication.

