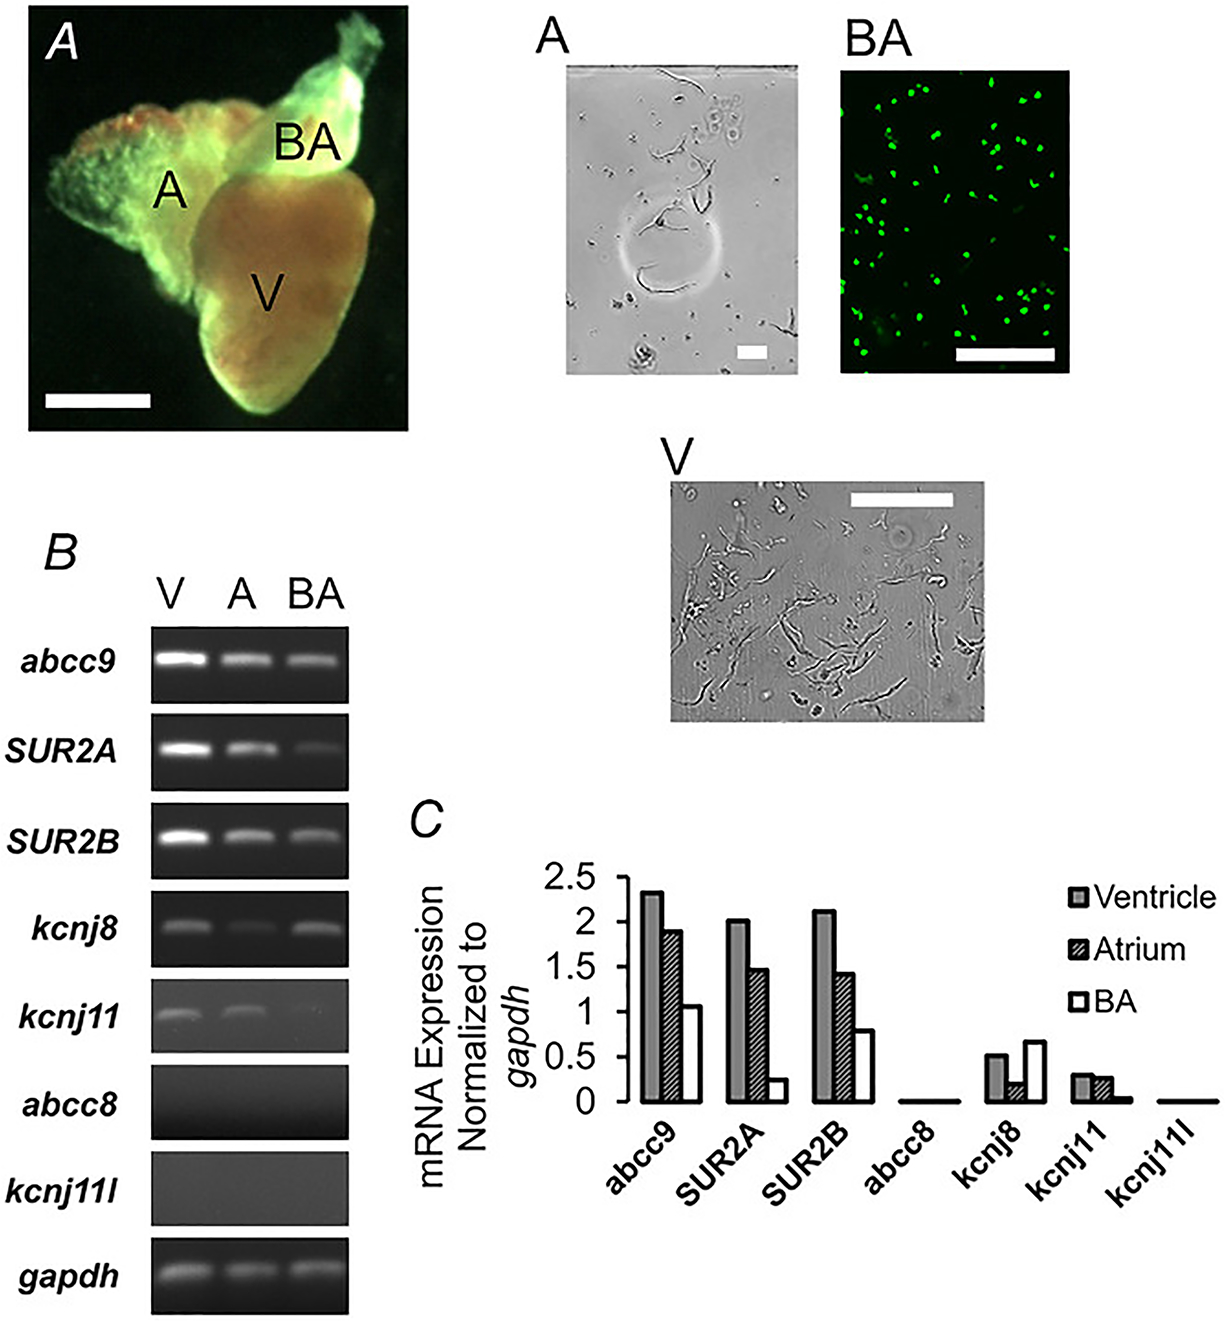
Figure 1. Zebrafish cardiovascular cell types and KATP channel subunit expression.

A, photomicrograph (left) of isolated zebrafish heart (green filter lens) reveals atrium (A), ventricle (V) and bulbous arteriosus (BA). Scale bar, 1 mm. Images of isolated cells (right) from each tissue. BA cells expressing GFP are shown under UV illumination. Scale bars, 100 μm. B, RT-PCR analysis of KATP channel subunit expression, including SUR2a and SUR2b isoforms and gapdh. C, quantification of data from B.
