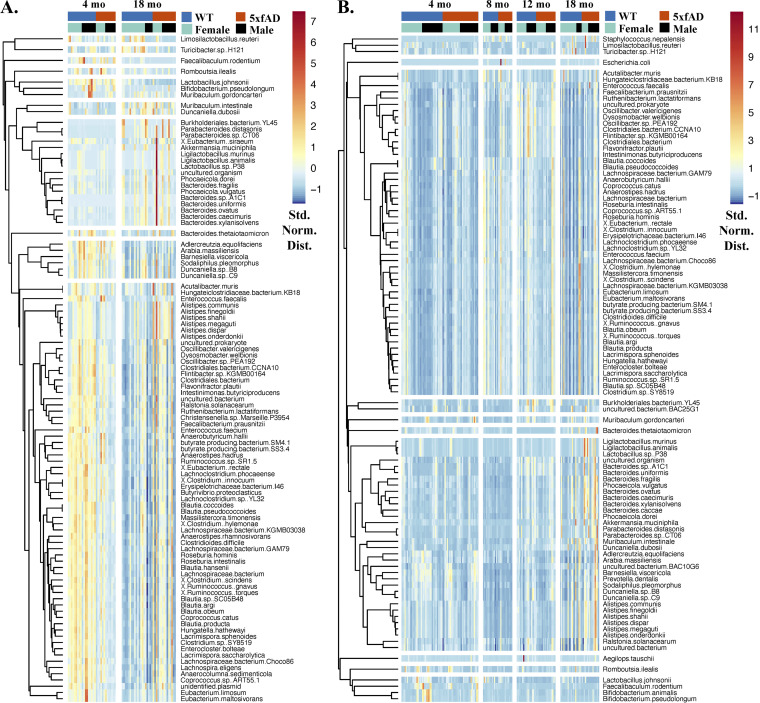
FIG 2.
Clustered heatmaps of the 100 most abundant microbial species in the cecal (A) and fecal (B) samples, with each sample represented by a column and each species represented by a row. The color scale indicates abundance (standard normal distribution), with hierarchical clustering being used to group microbes with similar abundance trends. The hierarchical clustering of species is represented by the dendrograms to the left of each figure.

