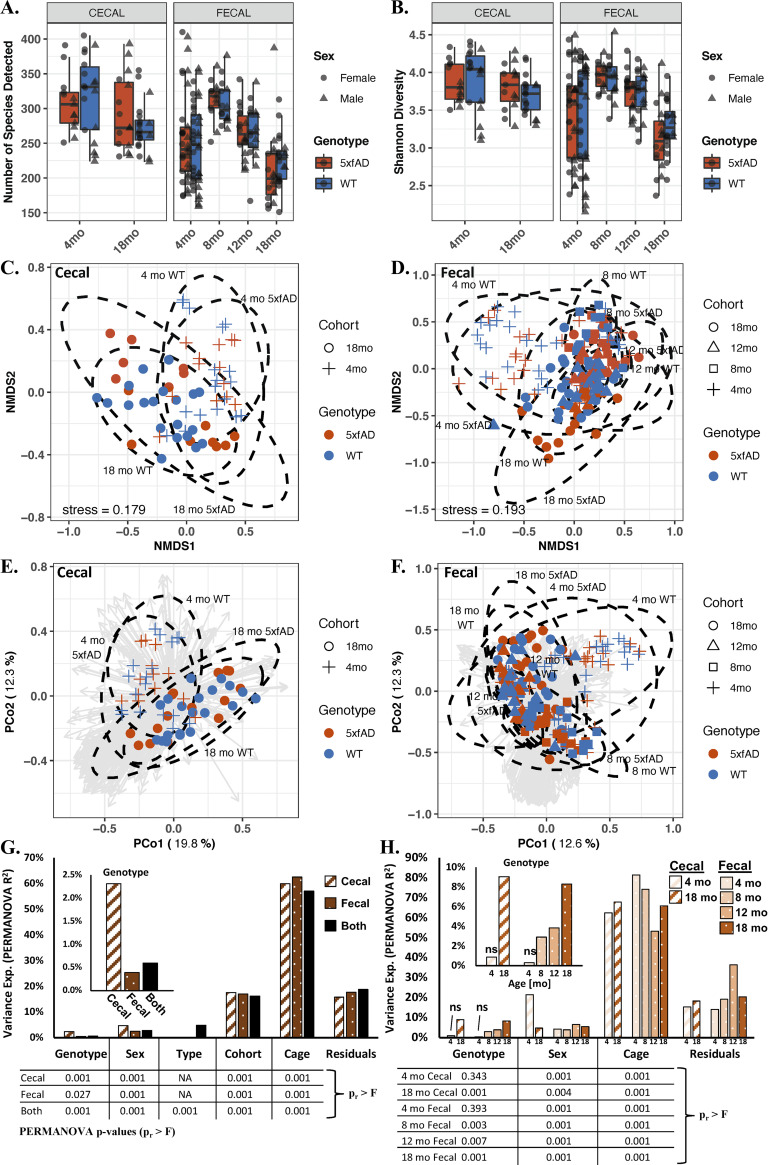
FIG 3.
Alpha and beta diversities of the cecal and fecal microbiomes of 5xfAD and WT mice from 4 to 18 months of age. Shown are the species richness (A), Shannon diversity (B), nonmetric multidimensional scaling (NMDS) for the cecal (C) and fecal samples (D), PCoA the cecal (E) and fecal (F) samples, and variance explained by permutational multivariate analysis of variance (PERMANOVA) for all of the cohorts combined (G) and for each cohort considered separately (H). Alpha diversity (A and B) was not significantly different between genotypes, but it was significantly different with respect to age (richness: P < 0.05 for age, P > 0.05 for genotype via a two-way ANOVA; Shannon: P < 0.05 for age, P > 0.05 for genotype via a Kruskal-Wallis one-way ANOVA). The beta diversity, as visualized by NMDS (C and D) and a principal coordinates analysis (PCoA) (E and F) of the Bray-Curtis dissimilarity matrices, largely showed separation by age but not by genotype. PERMANOVA (G and H) shows that most of the variance in microbiome composition is attributed to housing assignment. All variables examined are significant, except for genotype in the 4-month samples (PERMANOVA P < 0.05), and the variance attributable to genotype increases with the age of the mice. The box plots in panels A and B show the median value +/− the first and third quartiles, with the whiskers showing the range or 1.5× the interquartile range, whichever is less. The analysis in Panels C–H was performed on the relative abundance data, with ellipses in C-F representing the 95% confidence interval for each age-genotype grouping. The arrows in panels E and F are PCoA loading eigenvectors, with each vector representing the direction and magnitude of a given microbe to the PCoA separation. The tabulated P values below the bar graphs in panels G and H were computed via PERMANOVA. More PERMANOVA details are provided in Table S1.

