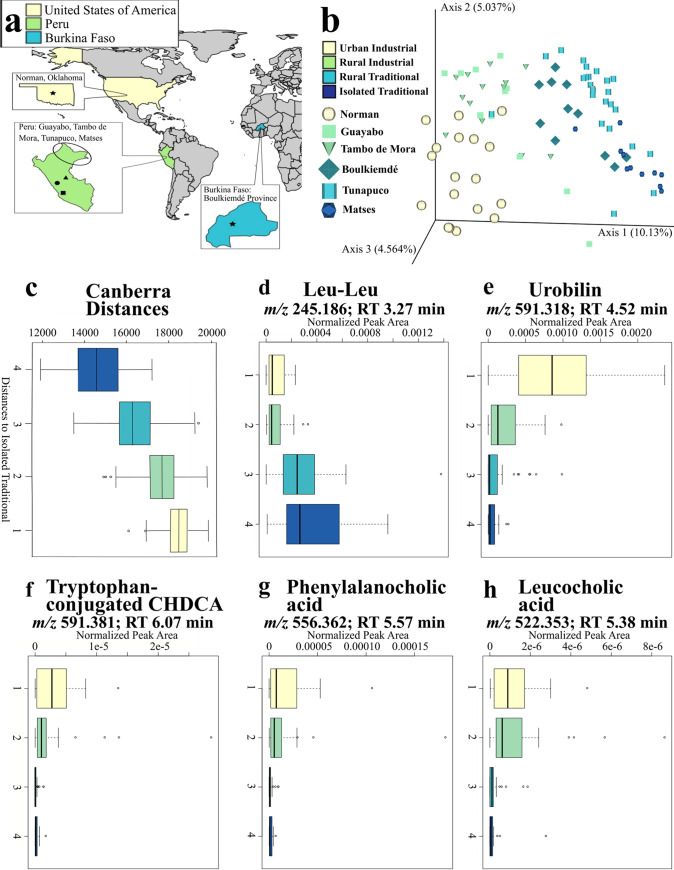
FIG 1.
Fecal metabolomic profiles follow an industrialization gradient. Derived from analyses where sample size (n) = 90. (a) Sampling sites. Star on tan background, Norman (n = 18); circle on green background, Guayabo (n = 12); square on green background: Tambo de Mora (n = 14); triangle on green background, Tunapuco (n = 24); oval on green background, approximate Matses location (n = 11); star on a blue background, Boulkiemdé (n = 11). The specific Matses location was left unmarked due to privacy concerns. (b) Principal-coordinate analysis (Canberra distance metric) depicts the industrialization gradient, colored by industrialization category and shape-coded by population. Population samples stored in freezer within 1 day of collection (Norman and Boulkiemdé) are increased in size compared to samples stored within 4 days of collection (all Peruvian samples—Guayabo, Tambo de Mora, Tunapuco, and Matses). (c to h) Boxplot axis numbers represent different industrialization groups: 1, urban industrial; 2, rural industrial; 3, rural traditional; 4, isolated traditional. (c) Calculated Canberra distances follow an industrialization gradient, colored by industrialization category. The color key from panel b applies to panels c to h. (d and e) Normalized abundances of representative features identified by random forest analysis differing by industrialization category, (d) Leucyl-leucine (leu-leu), associated with nonindustrialized populations (m/z, 245.186; RT, 3.27 min). (e) Urobilin, associated with industrialized populations (m/z, 591.318; RT, 4.16 min). (f to h) Normalized abundances of amino acid-conjugated bile acids depict an industrialization gradient. (f) Tryptophan-conjugated chenodeoxycholic acid (CHDCA) (m/z, 591.381; RT, 6.07 min). (g) Phenylalanocholic acid (m/z, 556.36; RT, 5.57 min). (h) Leucocholic acid (m/z, 522.353; RT, 5.38 min).

