FIG 2.
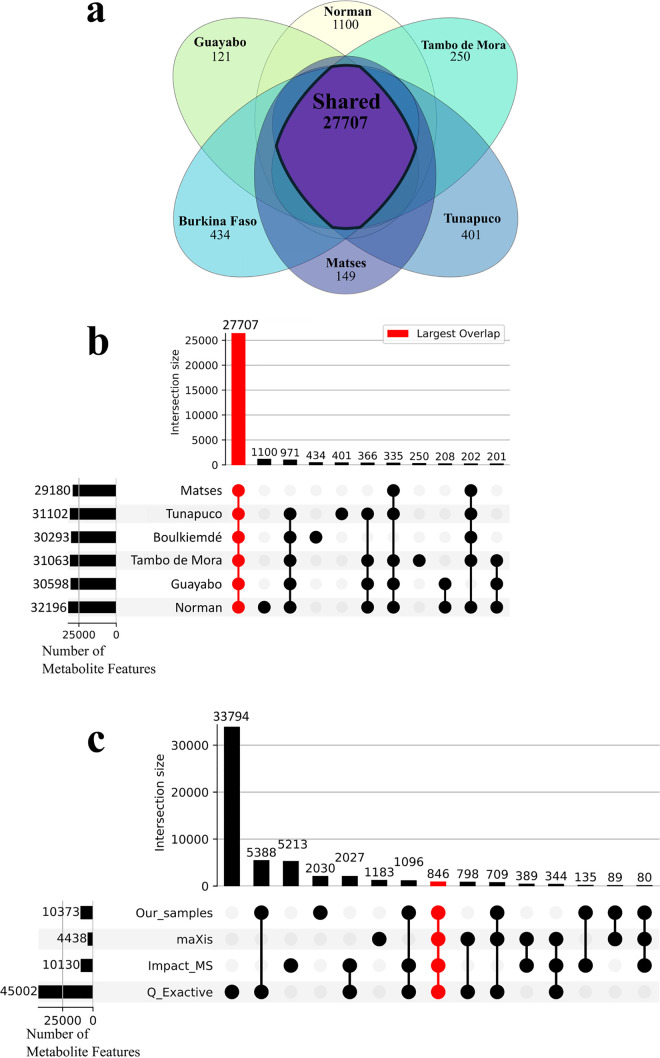
The shared human metabolome, where n = 90 (Norman n = 18, Guayabo n = 12, Tambo de Mora n = 14, Boulkiemdé n = 11, Tunapuco n = 24, and Matses n = 11). (a) Metabolic feature overlap across study populations in gap-filled data. (b) The UpSet plot of gap-filled data indicates strong similarity of metabolomic profiles. The total number of metabolite features for each sampled population is depicted in rows with the number of overlapping features reported as bar graphs. More features were shared by all population groups than were seen across different group comparisons. The red colored box highlights the intersection of all populations (27,707 total metabolite features). (c) ReDU coanalysis data sets sorted by MS instrument: Thermo Fisher Scientific Q Exactive (n = 696), Bruker Impact (n = 447), Bruker maXis (n = 143). The coanalysis illustrates overlap across the data sets, despite instrumental differences. The colored box highlights the intersection of all data sets (846 total metabolite features).

