FIG 1.

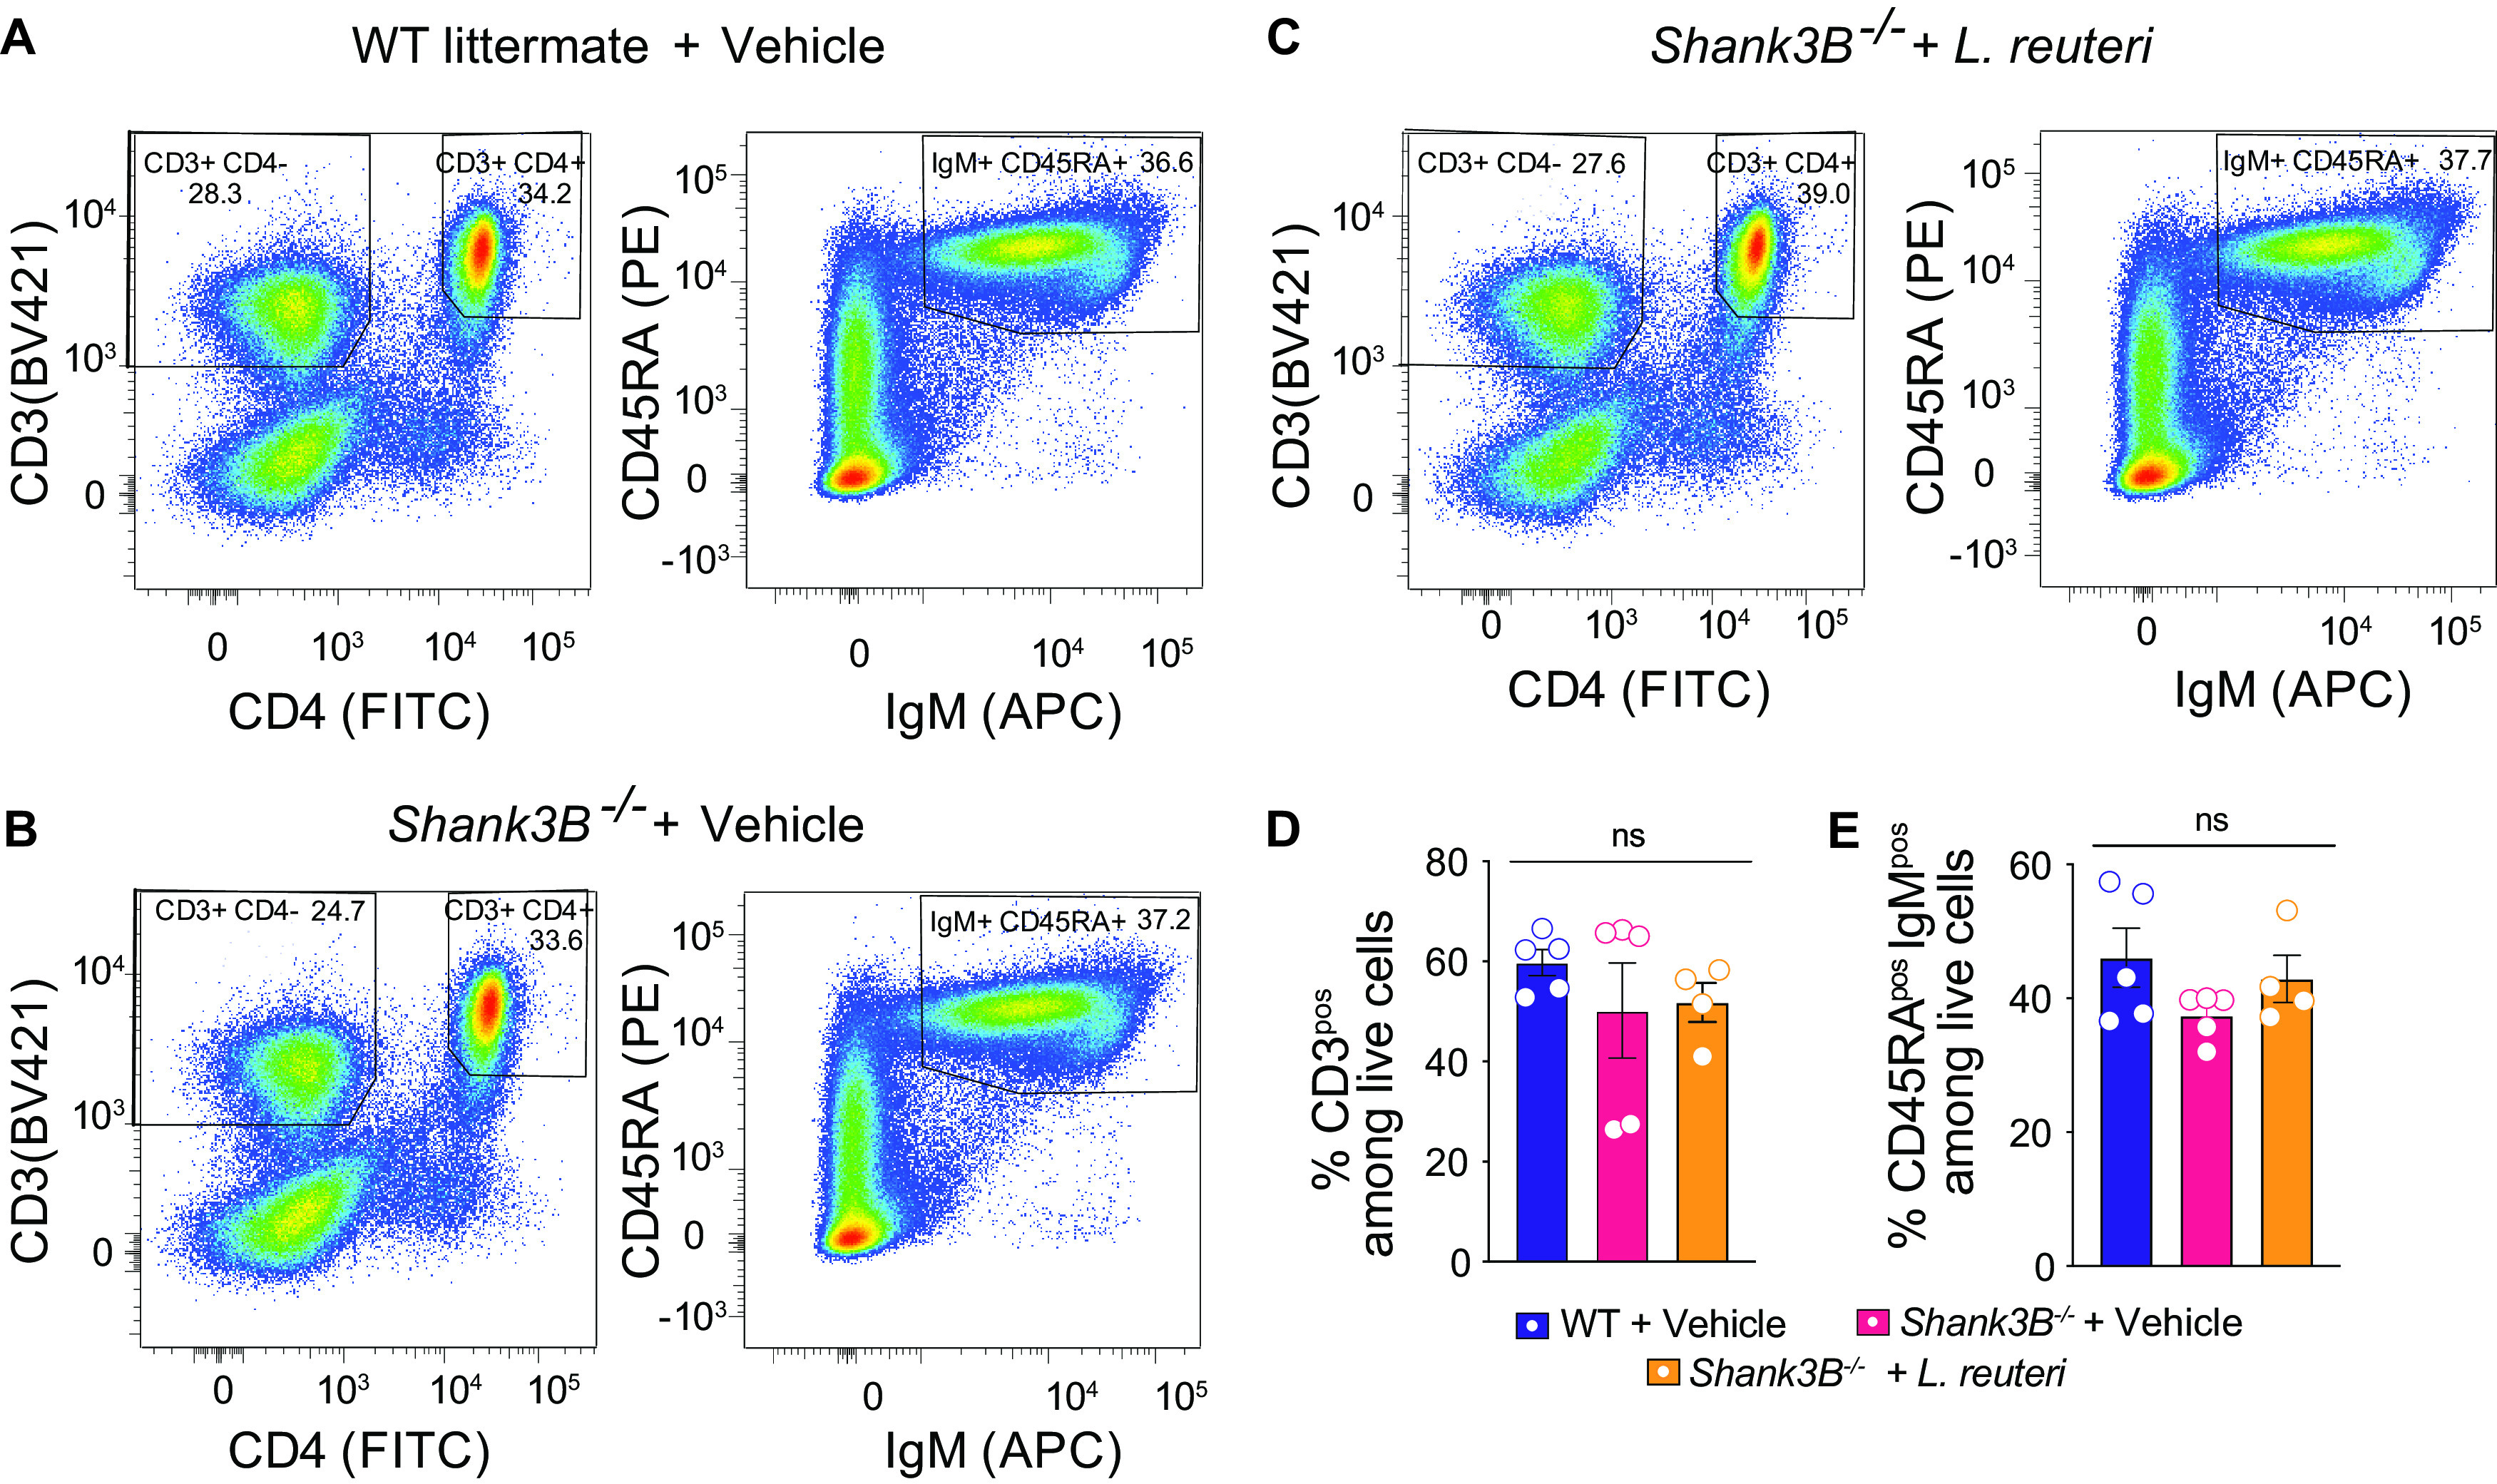
Shank3B−/− mice do not show changes in the percentages of mature T and B lymphocytes compared to their controls, and L. reuteri does not influence the number of adaptive immune cells. (A to D) Flow cytometry analysis of CD3, CD4, IgM, and CD43RA expression in the spleen cells of WT littermate + vehicle, Shank3B−/− + vehicle, and Shank3B−/− + L. reuteri (n = 4 to 5 mice per group). (A) Distribution of CD3, CD4, IgM, and CD43RA signal in WT littermate + vehicle. (B) Distribution of CD3, CD4, IgM, and CD43RA signal in Shank3B−/− + vehicle. (C) Distribution of CD3, CD4, IgM, and CD43RA signal in Shank3B−/− + L. reuteri. (D) Percentage of all CD3+ cells. (WT littermate versus Shank3B−/−: q = 2.646, P = 0.1929; Shank3B−/− versus Shank3B−/− + L. reuteri: q = 1.576, P = 0.5252; WT littermate versus Shank3B−/− + L. reuteri: q = 0.9181, P = 0.7966 [one-way ANOVA with Tukey post hoc test, P = 0.2131]). (E) Percentage of IgM+ and CD43RA+ cells. (WT littermate versus Shank3B−/−: q = 1.544, P = 0.5382; Shank3B−/− versus Shank3B−/− + L. reuteri: q = 0.2462, P = 0.9835; WT littermate versus Shank3B−/− + L. reuteri: q = 1.210, P = 0.6779 [one-way ANOVA with Tukey post hoc test, P = 0.5310]). ns, nonsignificant. Bar graphs show means ± the SEM with individual data points.
