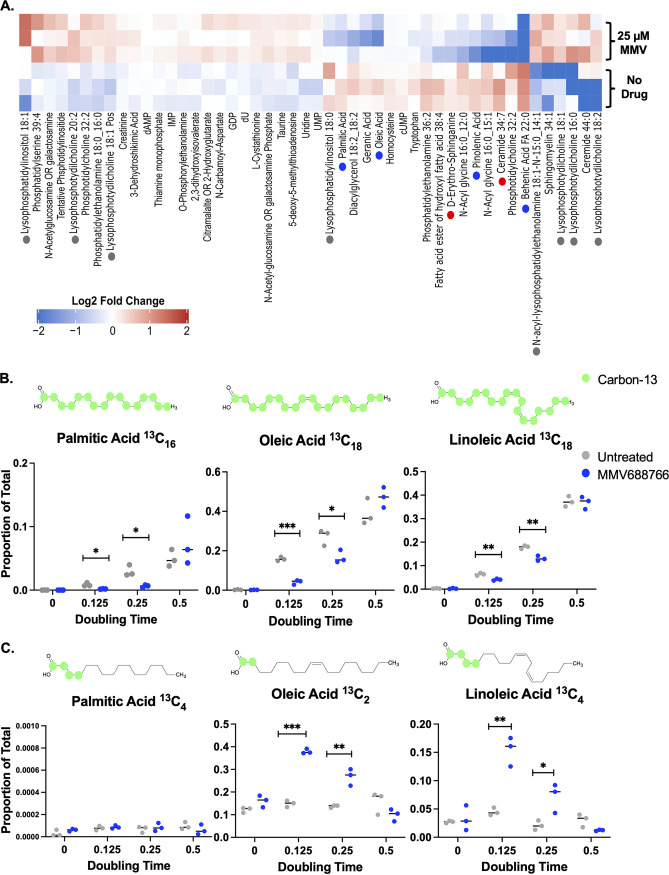
FIG 5.
Treatment of C. auris with MMV688766 leads to a reduction in fatty acid and sphingolipid intermediate levels as a result of delayed fatty acids synthesis. (A) C. auris (CDC0387) overnight cultures (n = 3) were diluted to an OD600 of ~0.1 and left to grow for 2 h at 30°C in YNB medium supplemented with 2% glucose. Cells were then grown in the presence or absence of 25 μM MMV688766 for an additional 4 h. Lipids were extracted from ~5× 10⁸ cells for each sample, and lipidomics were performed via reverse-phase chromatography for all nonpolar lipids and ion-paired reverse-phase chromatography for all polar lipids. Metabolic features differentially enriched across treatments were selected, and matched using exact mass and MS2 spectral databases using Metaboscape (Bruker). Metabolite levels were median centered and log2 transformed (red: increased abundance, blue: decreased abundance see color bar). Blue dots are used to denote fatty acids, gray dots represent lyso-phospholipids, and red dots represent sphingolipid precursors. Samples are plotted in technical triplicate (n = 3). (B) C. auris (CDC0387) samples unlabeled (t = 0) and labeled with 13C2-acetate grown at 0.125 (t = 22 min), 0.25 (t = 44 min), and 0.5 (t = 88 min) doubling times were evaluated for the 13C occupancy of diverse fatty acids using mass spectrometry. The proportion of fully labeled (C-13 depicted as green circles on representative chemical structures) palmitic (13C16), oleic (13C18), and linoleic acid (13C18) compared to total cellular lipids profiled is plotted at each doubling time (blue = 25 μM MMV688766, gray = no drug). (C) The proportion of partially labeled, elongated (C-13 depicted as green circles on representative chemical structures) palmitic (13C4), oleic (13C2), and linoleic acid (13C4) compared to total cellular lipids profiled is plotted at each doubling time (blue = 25 μM MMV688766, gray = no drug). Samples are plotted in biological triplicate (n = 3) and analyzed using unpaired t test with Welch’s correction: *, P < 0.05; **, P < 0.005; ***, P < 0.001.

