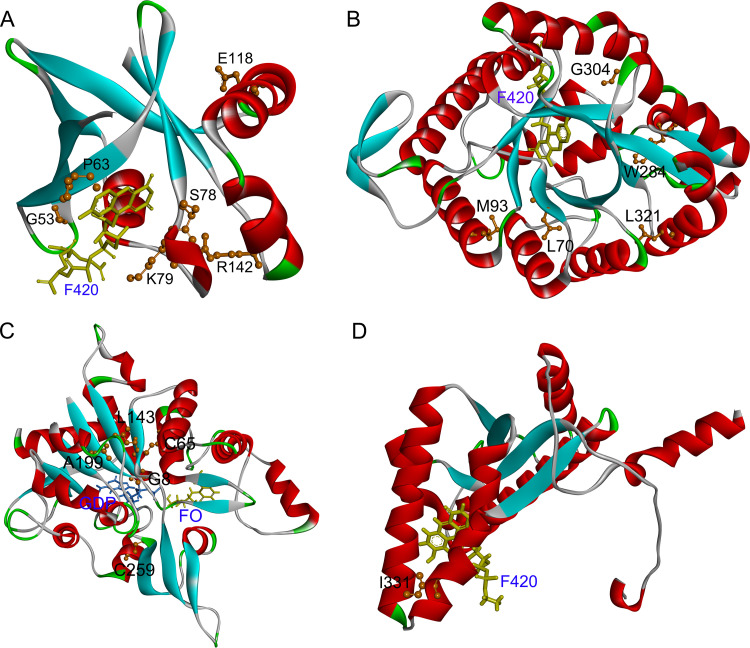
FIG 2.
Structure of the MTB Ddn (A), Fgd1 (B), FbiA (C), and FbiB (D) complexed with cofactors. (A) Ribbon representation of Ddn with cofactor F420 (PDB code 3R5R). The F420 (yellow) is shown with a display style of stick. (B) Ribbon representation of Fgd1 complexed with F420 (PDB code 3B4Y). The F420 (yellow) was displayed in stick. (C) Ribbon representations of the predicted FbiA-FO-GDP complex. The cofactors FO (yellow) and GDP (blue) were displayed in stick. (D) Ribbon representation of FbiB complexed with F420 (PDB code 4XOQ). The F420 (yellow) was displayed in stick. The identified mutated residues (orange) were represented with a display style of ball and stick. The images were obtained using the Discovery Studio Visualizer v.4.5 software.

