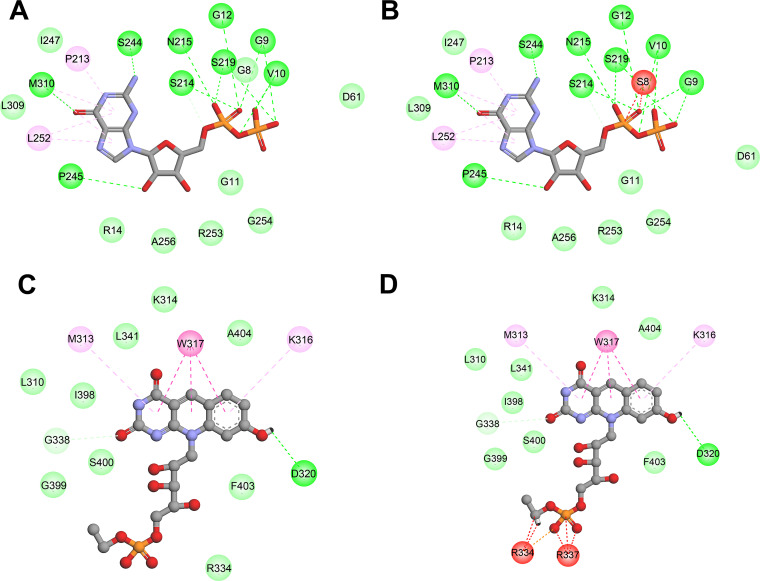
FIG 4.
The 2D diagram showing the interactions between GDP and wild-type FbiA(A), mutant G8S (B), and the interactions between F420 and wild-type FbiB (C), mutant I331L (D). The GDP (A and B) and F420 (C and D) molecules are shown in the middle with a display style of ball and stick. The colored balls around GDP or F420 indicate the residues involved in the direct interactions between the ligand and the protein. The green, magenta, and red dashed lines connecting the ligand and the corresponding residues indicate intermolecular hydrogen bonds, hydrophobic interactions, and steric hindrance, respectively. Residues involved in hydrogen bonds, van der Waals interactions, or polar interactions are represented by green balls. Residues involved hydrophobic interactions and unfavorable bumps are represented by magenta and red balls, respectively.

