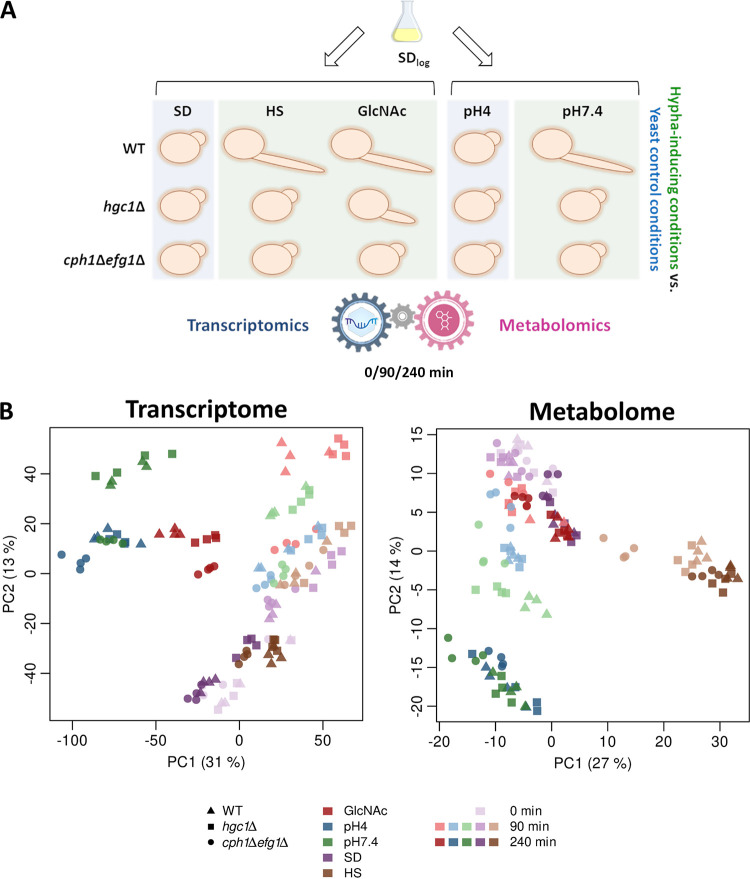
FIG 1.
Overview of metabolic and transcriptional profiling during yeast-to-hypha transition. (A) Study setup: C. albicans WT, hgc1Δ, and cph1Δ efg1Δ strains were grown in SD medium until early log phase and transferred to yeast-inducing (SD, pH 4) and hypha-inducing (GlcNAc, HS, and pH 7.4) media. Samples for transcriptional and metabolic profiling were taken simultaneously from identical cultures in four biological replicates. Sampling time points were after 0 (SD log phase only), 90, and 240 min. To identify hypha-associated changes, conditions were always compared as follows: HS and GlcNAc versus SD and pH 7.4 versus pH 4. (B) PCA plots reveal differing clustering behaviors between transcriptome and metabolome. Each symbol represents a biological replicate belonging to a test condition characterized by three parameters: strain (shape), medium type (color), and time point (color intensity). For example, dark red triangles represent replicates for WT in GlcNAc at 240 min.

