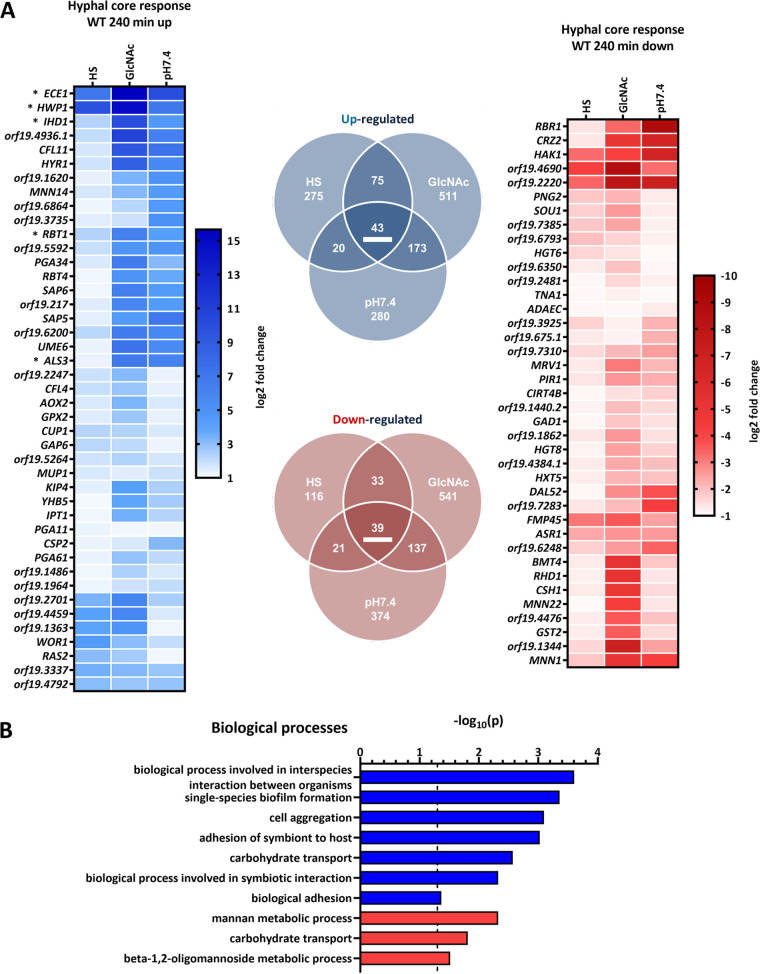
FIG 2.
Transcriptional core response of WT hyphae after 240 min. (A) Genes affected by the yeast-to-hypha transition in elongated hyphae (HS and GlcNAc versus SD and pH 7.4 versus pH 4) after 240 min. Only genes meeting the following criteria were included: P < 0.05 and log2 fold change ≤−1 or ≥1. Upregulation is indicated in blue and downregulation in red. Expression changes (log2) of the respective core response genes (underlined in the Venn diagram) are displayed. Asterisks indicate core filamentation response genes previously described in the work of Martin et al. (21). (B) Significantly enriched GO terms for the hyphal core response in the WT at 240 min. GO analysis was performed twice with either upregulated (blue) or downregulated (red) genes. Significance threshold for GO terms [P = −log10(0.05)] is indicated by the dashed line.

